MiWORD of the day is…logistic regression!

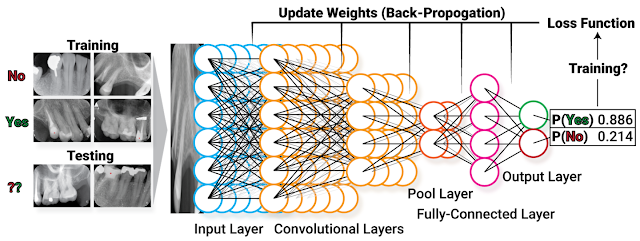
In a neuron, long, tree-like appendages called dendrites receive chemical signals – either excitatory or inhibitory – from many different surrounding neurons. If the net signal received in the neuron’s cell body exceeds a certain threshold, then the neuron fires and the electrochemical signal is transmitted onwards to other neurons. Sure, this process is fascinating, but what does it have to do with statistics and machine learning?

Well, it turns out that the way a neuron functions – taking a whole bunch of weighted inputs, aggregating them, and then outputting a binary response – is a good analogy for a method known as logistic regression. (In fact, Warren McCulloch and Walter Pitts proposed the “threshold logic unit” in 1943, an early computational representation of the neuron that works exactly like this!)

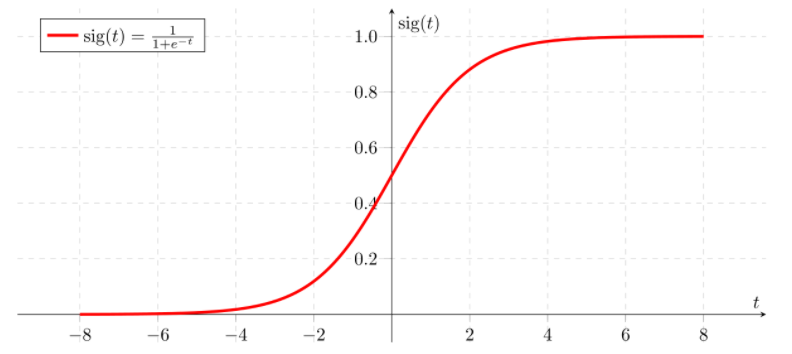
Perhaps you’ve heard of linear regression, which is used to model the relationship between a continuous scalar response variable and at least one explanatory variable. Linear regression works by fitting a linear equation to the data, or, in other words, finding a “line of best fit.” Logistic regression is similar, but it instead “squeezes” the output of a linear equation between 0 and 1 using a special sigmoid function. In other words, linear regression is used when the dependent variable is continuous, and logistic regression is used when the dependent variable is categorical.

Since the output of the sigmoid function is bounded between 0 and 1, it’s treated as a probability. If the sigmoid output for a particular input is greater than the classification threshold (for instance, 0.5), then the observation is classified into one category. If not, it’s classified into the other category. This ability to divide data points into one of two binary categories makes logistic regression very useful for classification problems.

Let’s say we want to predict whether a particular email is spam or not. We might have a dataset with explanatory variables like the number of typos in the email or the name of the sender. Once we fit a logistic regression model to this data, we can calculate “odds ratios” for each of the two explanatory variables. If we got an odds ratio of 2 for the variable representing the number of typos in the email, for example, we know that every additional typo doubles the estimated odds chance of the email being spam. Much like the coefficients in linear regression, odds ratios can give us a sense of a variable’s “importance” to the model.

Now let’s use “logistic regression” in a sentence.

Serious: I want to predict whether this tumour is benign or malignant based on several tissue characteristics. Let’s fit a logistic regression model to the data!

Less serious: 

Person 1: I built a neural network!

Person 2: Hey – that’s cheating! You only used a *single* neuron, so you’re basically just doing logistic regression…

See you in the blogosphere!

Jacqueline Seal

Jenny Du’s ROP299 Journey: Telling apart the real and the fake!

My name is Jenny Du, and I have just wrapped up my ROP299 project in the Tyrrell Lab, as well as my second year at the University of Toronto, pursuing a bioinformatics specialist. Looking back, it was a bumpy ride, but in the end, this journey was very rewarding and has taught me a lot of things on both machine learning topics as well as the process of scientific research.

Like most of the other ROP299 students, I had no experience with machine learning and neural networks. Despite doing some research beforehand, I found myself googling what everyone was talking about during the weekly meetings (thankfully, they were online) to make sure I was not completely lost. None of my first-year courses had prepared me for these kinds of things! And so, with some uncertainties in my heart, I started my ROP journey.

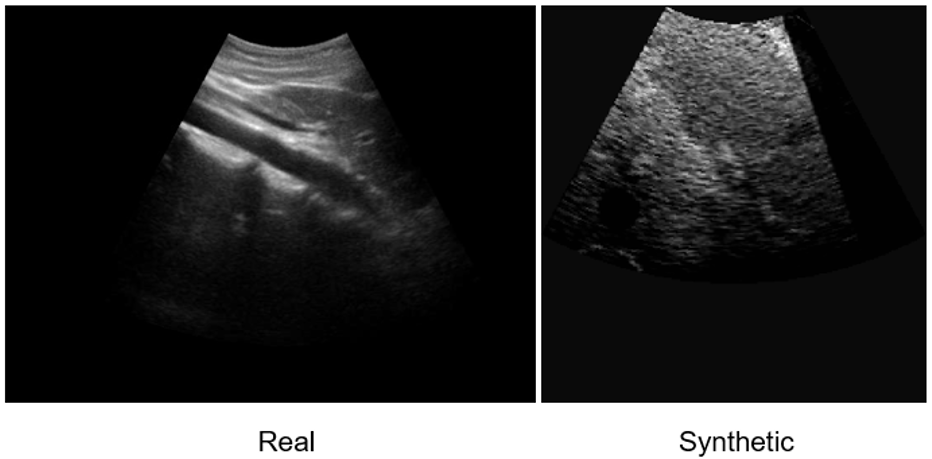
I decided on my overall research topic fairly early, but the details were adjusted several times as I progressed through my project. My project is about coming up with a way to quantitatively assess a set of synthetic ultrasound images in terms of how “realistic” they look compared to the real ultrasound images. “Realism” here is defined as whether the synthetic images can be used as training images in replacement of the real images without creating too big of an impact on the machine learning algorithm. At first, I came up with a naïve proposal: I will build an algorithm that differentiates real and synthetic ultrasound images, and if the algorithm can classify the two kinds (with high accuracies), then it means that the synthetic images are not realistic, and vice versa. In the weekly meeting, Dr. Tyrrell immediately pointed out why this wouldn’t work. In my proposal, a low accuracy could mean that the synthetic and the real images are very similar, but it could also mean that the algorithm itself is terrible. For example, if my algorithm has 50% accuracy, then it is basically randomly guessing each image, like a coin toss, so its classification is unreliable, to say the least. He suggested that I look online to see how others have done it. There was very little information that directly relates to what I’m doing, but eventually I was able to come up with a plan to extract features from the images using a pre-trained CNN model and measure the cosine similarity score between two images and graph these values into a histogram to see their distribution. Dr. Tyrrell also suggested that I compare the distributions at different equivalence margins to determine how big a mean difference is acceptable.

Thankfully, I was able to find some code online that I was able to use in my project with minor changes, and I was able to produce some distribution data fairly quickly. Then, I encountered what I considered to be the hardest part of my entire project: to statistically interpret and discuss my data and create a conclusion out of it. Since I am not a statistics student, and so my knowledge of statistics is limited to one stats course I took as a part of my program requirements. It took a while for me to learn all these statistical concepts and understand why each is needed in my project.

This year was especially interesting since everything was online. Despite not being able to see each other face-to-face, I was still able to receive much support from Dr. Tyrrell and other students in the lab. Mauro was very helpful in preparing the datasets for my project as well as answering any problems related to the codes. Guan also helped to check my statistical calculations and clarifying some hard concepts. I have also made great friends with the other ROP students this year, and hopefully we will be able to see each other in person when the school re-opens.

Overall, this journey was a wonderful experience, and I have learned many things from it. Not only did I got some familiarity with machine learning topics and their application in medicine, but I have also gained experience in the general academic research process, from coming up with a topic to the actual implementation to the final reports. There were challenges along the way, but in the end, it was very rewarding. I am extremely thankful to Dr. Tyrrell for the guidance and support and am grateful for this opportunity.

Jenny Du

MiWORD of the Day Is…Cosine Distance!

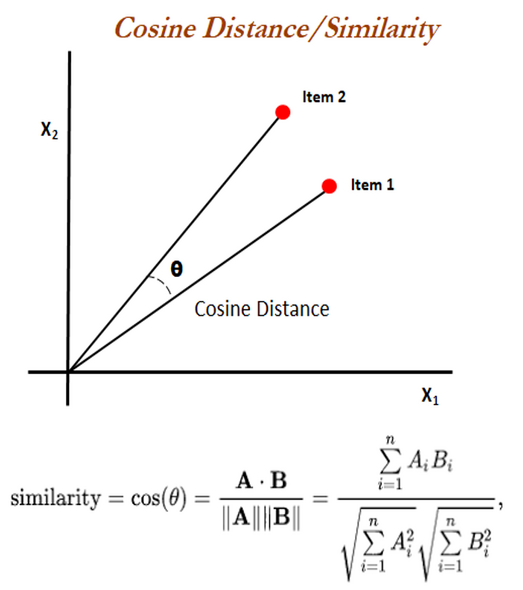
            Today we will talk about a way to measure distance, but not about how far away two objects are. Instead, cosine distance, or cosine similarity, is a measure of how similar two non-zero vectors are in terms of orientation, or to put it simply, the direction to which they point. Mathematically, the cosine similarity between two 2-D vectors is equal to the cosine of the angle between them, which can also be calculated using their dot product and magnitudes, as shown on the right. Two vectors pointing in the same direction will have a cosine similarity of 1; two vectors perpendicular to each other will have a similarity of 0; two vectors pointing in opposite direction will have a similarity of -1. Cosine distance is equal to (1 – cosine similarity). In this case, two vectors will have a cosine distance between 0 to 2: 0 when they are pointing in the same direction, and 2 when they are pointing in opposite direction. Cosine similarity and distance essentially measure the same thing, but the distance will convert any negative values to positive.

           Cosine distance and similarity also apply to higher dimensions, which makes them useful in analyzing images, texts, and other forms of data. In machine learning, we can use an algorithm to process a dataset of information and store each object as an array of multidimensional vectors, where each vector represents a feature. Then, we can use cosine similarity to compare how similar each pair of vectors are between the two objects and come up with an overall similarity score. In this case, two identical objects will have a similarity score of 1. In higher dimensions, we can rely on the computer to do the calculations for us. For example, we have the distance.cosine function in the SciPy package in Python will compute the cosine distance between two vector arrays in one go.

Here are two examples of how you can use cosine distance in a conversation:

Serious:  “I copied an entire essay for my assignment and this online plagiarizing checker says my similarity score is only 1! Time to hand it in.” “It says a COSINE similarity of 1. Please go back and write it yourself…”

Less serious: *during a police car chase* “Check how far are we from the suspect’s car!” “Well, assuming that he doesn’t turn, the distance between us will always be zero. Remember from your math class? Two vectors pointing in the same direction will always have a cosine distance of zero…”

… I’ll see you in the blogosphere.

Jenny Du

Parinita Edke’s ROP experience in the Tyrrell Lab!

Hi! My name is Parinita Edke and I’m finishing my third year at UofT, specializing in Computer Science with a minor in Statistics. I did a STA399Y research project with Professor Tyrrell from September 2020 – April 2021 and I am excited to share my experience in the lab!

I have always been interested in medicine and the applications of Computer Science and Statistics to solve problems in the medical field. I was looking out for opportunities to do research in this intersection and was excited when I saw Professor Tyrrell’s ROP posting. I applied prior to the second-round deadline and waited to hear back. After almost 2 weeks past the deadline, I had still not heard back and decided to follow up on the status of my application. I quickly received a reply from Professor Tyrrell that he had already picked his students prior to receiving my application. While this was extremely disappointing, I thanked Professor Tyrrell for his time and expressed that I was still interested in working with him during the year and attached my application package to the email. I was not really expecting anything coming out of this, so I was extremely happy when I received an invite to an interview! After a quick chat with Professor Tyrrell about my goals and fit for the lab, I was accepted as an ROP student!

Soon after being accepted, I joined my first lab meeting where I was quickly lost in the technical machine learning terms, the statistical concepts and the medical imaging terminology used. I ended the meeting determined to really begin understanding what machine learning was all about!

This marked the beginning of the long and challenging journey through my project. When I decided on my project, it seemed interesting as solving the problem allowed for some cool questions to be answered. The task was to detect the presence of blood in ultrasound images of the knee joint; my project was to determine if Fourier Transformation can be used to generate features to perform the task at hand well. It seemed quite straightforward at first – simply generate Fourier Transformed features and run a classification model to get the outputs, right? After completing the project, I am here to tell you that it was far from being straightforward. It was more like a zigzag progress pattern through the project. The first challenge that I faced was understanding the theory behind the Fourier Transform and how it applies to the task at hand. This took me quite some time to fully grasp and was definitely one of the more challenging parts of the project. The next challenge was figuring out the steps and the things I would need for my project. Rajshree, a previous lab member, had done some initial work using a CNN+SVM model. I first tried to replicate what Rajshree had done in order to create a baseline to compare my approach to. It took me some time to understand what each line of code did within Rajshree’s model but after I was able to get it to work, I felt amazing! Reading through Rajshree’s code gave me more experience in understanding the common Python libraries used in machine learning, so when I built my model, it was much quicker! When I ran my model for the first time, I felt incredible! The process was incredibly frustrating at times, but when I saw results for the first time, I felt like all this struggle was worth it. Throughout this process of figuring out the project steps and building the model, Mauro was always there to help, always being enthusiastic when answering any questions I had and giving me encouragement to keep going.

Throughout the process, Professor Tyrrell was always there as well – during our weekly ROP meetings, he always reminded us to think about the big picture of what our projects were about and the objectives we were trying to accomplish. I definitely veered off in the wrong direction at times, but Professor Tyrrell was quick to pull me back and redirect me in the right direction. Without this guidance, I would not have been able to finish and execute the project in the way that I did and am proud of.

Looking back at the year, I am astonished at the number of things I have learned and how much I have grown. Everything that I learned, not only about machine learning, but about writing a research paper, learning from others and your own mistakes, collaborating with others, learning from even more of my own mistakes, and persevering when things get tough will carry with me throughout the rest of my undergraduate studies and the rest of my professional career.

Thank you, Professor Tyrrell, for taking a chance on me. He could have simply passed on my application but the fact that he took a chance with me and accepted me into the course lead to such an invaluable experience for me which I truly appreciate. The experiences and the connections I have made in this lab have been a highlight of my year, and I hope to keep contributing to the lab in the future!

Parinita Edke

Dianna McAllister’s ROP Adventures in the Tyrrell Lab!

My name is Dianna McAllister and I am approaching the finish of my second year at University of Toronto, pursuing a bioinformatics specialist and computer science major. This year I was given the incredible opportunity to work in Dr. Tyrrell’s lab for the ROP299 course.
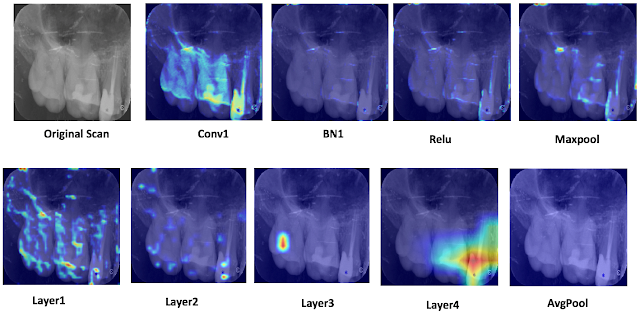
I have just handed in my first ever formal research paper for my work in Dr. Tyrrell’s lab. My project observed the effectiveness of using grad-CAM visualizations on different layers in a convolutional neural network. Though the end results of my project were colourful heat maps placed on top of images, the process to get there was not nearly as colourful or as effortless as the results may seem. There was lots of self-teaching, debugging, decision-making and collaboration that went on behind the scenes that made this project difficult, but much more rewarding when complete.
My journey in Dr. Tyrrell’s lab began when I first started researching ROP projects. I can still remember scrolling through the various projects, trying to find something that I thought I would be really passionate about. Once I happen upon Dr. Tyrrell’s ROP299, I could feel my heart skip a beat- it was exactly the research project that I was looking for. It explained the use of machine learning in medicine, specifically medical imaging. Being in bioinformatics, this project was exactly what I was looking for; it integrated biology and medicine with computer science and statistics. Once I saw this unique combination, I knew that I needed to apply.
After I applied, I was overjoyed that I had received an interview. When I attended the interview, I was very excited to show Dr. Tyrrell my interest in his research and explain how my past research would help me with this new project. But once I walked into his office, it was unlike any other interview I had ever had; he was able to point out things about myself that I had barely even realized and asked me many questions that I had no answer to. I remember walking out of that interview feeling disappointed as I thought that there was no way I would get a position in his lab, but a few weeks later heard back that I had gotten the position! I was delighted to have the opportunity to prove to Dr. Tyrrell that he made a good choice in choosing me for the position and that I would work hard in his lab and on my project.
The night before my first lab meeting, I researched tons of information on machine learning, making sure to have- what I thought- an in-depth understand of machine learning. But after less than five minutes into the lab meeting, I quickly realized that I was completely wrong. Terms like regression, weights, backpropagation were being thrown around so naturally, and I had absolutely no idea what they were talking about. I walked out of the meeting determined to really begin understanding what machine learning was all about!
Thus began my journey to begin my project. When I decided on my project, it seemed fun and not too difficult- all I have to do is slap on some heat maps to images, right? Well as much as I felt it wouldn’t be too difficult, I was not going to be deceived just as I had before attending our first meeting; and after completion I can definitely say it was not easy! The first problem that I encountered immediately was where to start. Sure, I understood the basic concepts associated with machine learning, but I had no experience or understanding of how to code anything related to creating and using a convolutional neural network. I was fortunate enough to be able to use Ariana’s CNN model. Her model used x-rays of teeth to classify if dental plates were damaged and therefore adding damage (artifacts) to the x-rays of teeth or if the plates were functional. It took me quite some time to understand what each line of code did within the program- the code was incredible, and I could not imagine having to write it from scratch! I then began the code to map the grad-CAM visualizations (resembling heat maps) onto the images that Ariana’s model took as input. I was again fortunate enough to find code online that was similar to what I needed for my project. I made very minor tweaks until the code was functional and worked how I needed it to. Throughout this process of trying to debug my own code or figure out why it wouldn’t even begin running, Mauro was always there to help, always being enthusiastic even when my problem was as silly as accidentally adding an extra period to a word.
Throughout the process, Dr. Tyrrell was always there as well- he always helped me to remember the big picture of what my project was about and what I was trying to accomplish during my time in his lab. This was extremely valuable, as it kept me from accidentally veering off-course and focusing on something that wasn’t important to my project. Without his guidance, I would have never been able to finish and execute the project in the way that I did and am proud of.
Everything that I learned, not only about machine learning, but about how to write a research paper, how to collaborate with others, how to learn from other’s and your own mistakes and how to keep trying new ideas and approaches when it seems like nothing is working, I will always carry with me throughout the rest of my undergraduate experience and the rest of my professional future. Thank you, Dr. Tyrrell, for this experience and every opportunity I was given in your lab.
Dianna McAllister

Wendi in ROP399: Learning How the Machine Learns…and Improve It!


Hi everyone! My name is Wendi Qu and I’m finishing my third year in U of T, majoring in Statistics and Molecular Genetics. I did a ROP399 research project with Dr. Pascal Tyrrell from September 2018 – April 2019 and I would love to share it with you!
 
Artificial intelligence, or AI, is a rapidly emerging field becoming ever so popular nowadays, with exponentially increasing research published and companies established. Applications of AI in numerous fields has greatly improved efficacy and convenience, including facial recognition, natural language processing, medical diagnosis, fraud detection, just to name a few. In Dr. Tyrrell’s lab in the Department of Medical Imaging, the gears have been gradually switched from statistics to AI in the past two years for research students. With a Life Science and Statistics background, I’ve always been keen on learning the applications of statistics/data science in various medical fields to benefit both doctors and patients. Having done my ROP299 in Toronto General Hospital, I realized how rewarding it was to use real patient data to study disease epidemiology and how my research can help inform and improve future surgical and clinical practices. Therefore, I was extremely excited when I found out Dr. Tyrrell’s lab and really grateful for this amazing opportunity, where I can go one step further and do AI projects in the field of medical imaging.
 
Specifically, my projects focused on how to mitigate the effect of one of the common problems in machine learning – class imbalance. So, what is machine learning? Simply put, we feed lots of data to a computer, which has algorithms that find patterns in those data and use such patterns to perform different tasks. Classification is one of the common machine learning tasks, where the machine categorizes data to different classes (eg. categorizes an image to “cat” when shown a cat image). A common problem in medical imaging and diagnosis is that there’s way more “normal” data than “abnormal” ones. A machine learning model predicts more accurately when trained on more data, and the shortage of “abnormal” data, which are the most important ones, can impair the model’s performance in practice. Hence, finding methods to address this issue is of great importance. My motivation for doing this project largely comes from how my findings can offer insights on how different methods behave when training sets have different conditions, such as the severity of imbalance and sample size, which can be potentially generalized and help better implement machine learning in practice.
 
However, as with any research project, the journey was rarely smooth and beautiful, especially when I started with almost zero knowledge in machine learning and Python (us undergraduate statisticians only use R…). Starting off by doing a literature search, I realized many methods have been suggested to rectify class imbalance, with two main approaches being re-sampling (i.e. modify the training set) and modifying the cost function of the model. Despite many research done on this topic, I found that such methods were almost never studied systematically to assess their effect on training sets of different natures. The predecessor of this project, Indranil Balki, studied the effect of the class imbalance systematically by varying the class imbalance severity in a training set and see how model performance can be affected. Building on this, I decided to apply different methods to such already established imbalanced datasets and test for model improvement. Because more data lead to better performance, I was also curious if there’s a difference in how much different methods can improve the model in smaller and larger training sets.
 
One of the hardest parts of the project was making sure I was implementing the methods appropriately, and simply writing the code to do exactly what I want it to do. The latter part sounds simple but becomes really tricky when dealing with images in a machine learning context, and is again, even more challenging if you know nothing about Python… ! After digging into more literature, consulting “machine learning people” in the lab (a big shoutout to Mauro, Ahmed, Ariana, and of course, Dr. Tyrrell), I was able to develop a concrete plan, where I implement oversampling methods via image augmentation only when the imbalanced class has fewer images than other classes, and apply under sampling only when imbalanced class has more images; class weights in the cost function will also be adjusted as another method.
 
However, implementing them was a huge challenge. I self-learned Python by taking courses in Python, machine learning, image modification, random forest model, and anything that’s relevant to my project on Datacamp, a really useful website offering courses in different coding languages. Through this process and using Indranil’s code as a skeleton, I was finally able to implement all my methods and output the model’s prediction accuracy! It was a long, painful process which involved constant debugging, but it was never more rewarding to see the code finally run smoothly and beautifully!
 
This wonderful journey has taught me many things – not only have I taken my first step in machine learning, it again reminded me of the most valuable part of doing research, which combines independence, creativity, self-drive, and collaboration. Deciding on a topic, finding a gap, developing your own creative solutions, being motivated to learn new things and conquer challenges, and collaborating with intelligent people surrounding you, are the most invaluable experiences for me this year. Finally, I would love to thank all the amazing people in the lab, especially Mauro, whose machine learning knowledge, coding skills and humour were always there with me, and Dr. Pascal Tyrrell, with more questions back to us when we come with a question, enlightening advice, and a great personality. I appreciate
his amazing experience, and it has inspired me to delve deeper into machine learning and healthcare!
 
Wendi Qu


Rachael Jaffe’s ROP Journey… From the Pool to the Lab!

https://thevarsity.ca/2019/03/10/what-does-a-scientist-look-like/
My name is Rachael Jaffe and I am completing my third year in Global Health, Economics and Statistics. I had no clue what I was getting myself into this year during my ROP (399) with Dr. Tyrrell. I initially applied because the project description had to do with statistics,
and I was inclined to put my minor to the test! Little did I know that I was about to embark on a machine learning adventure.
My adventure started with the initial interview: after a quite a disheartening tale of Dr. Tyrrell telling me that my grades weren’t high enough and me trying to convince him that I would be a good addition to the lab because “I am funny”, I was almost 100% certain that I
wasn’t going to be a part of the lab for 2018-2019 year. If my background in statistics has taught me anything, nothing truly has a 100% probability. And yet, last April I found myself sitting in the department of medical imaging at my first lab meeting.
Fast forward to September of 2018. I was knee deep (well, more accurately, drowning) in machine learning jargon; from learning about the basics of a CNN to segmentation to what a GPU is. From there, I chose a project. Initially, I was just going to explore the relationship between sample size and model accuracy, but then it expanded to include an investigation in k-fold cross validation.
I started my project with the help of Ariana, a student from a lab in Costa Rica. She built a CNN that classifies dentistry PSP’s for damage. I modified it to include a part that allowed the total sample size to be reduced. The relationship between sample size and model accuracy is very well known in the machine learning world, so Dr. Tyrrell decided that I
should add an investigation of k-fold cross validation because the majority of models use this to validate their estimate of model accuracy. With further help from Ariana’s colleague, Mauro, I was able to gather a ton of data so that I could analyze my results statistically.
It was more of a “academic” project as Dr. Tyrrell noted. However, that came with its own trials and tribulations. I was totally unprepared for the amount of statistical interpretation that was required, and it took a little bit of time to wrap my head around the intersection of statistics and machine learning. I am grateful for my statistics minor during this ROP because without it I would’ve definitely been lost. I came in with a knowledge of python so writing and modifying code wasn’t the hardest part.
I learned a lot about the scientific process during my ROP. First, it is incredibly important to pick a project with a clear purpose and objectives. This will help with designing your project and what analyses are needed.  Also, writing the report is most definitely a process. The first draft is going to be the worst, but hang on because it will get better from there. Lastly, I learned to learn from my experience. The most important thing as a budding scientist is to learn from your mistakes so that your next opportunity will be that much better.
I’d like to thank Dr. Tyrrell for giving me this experience and explaining all the stats to me. Also, Ariana and Mauro were invaluable during this experience and I wish them both the best in their future endeavors!

Rachael Jaffe

Adam Adli’s ROP399 Journey in Machine Learning and Medical Imaging

My name is Adam Adli and I am finishing the third year of my undergraduate studies at the University of Toronto specializing in Computer Science. I’m going to start this blog post by talking a little bit about myself. I am a software engineer, an amateur musician, and beyond all, someone who loves to solve problems and treats every creation as art. I have a rather tangled background; I entered university as a life science student, but I have been a programmer since my pre-teen years. Somewhere along the way, I realized that I would flourish most in my computer science courses and so I switched programs in at the beginning of my third year.
 
While entering this new and uncertain phase in my life and career, I had the opportunity of meeting Dr. Pascal Tyrrell and gaining admission to his research opportunity program (ROP399) course that focused on the application of Machine Learning to Medical Imaging under the Data Science unit of the Department of Medical Imaging.
 
Working in Dr. Tyrrell’s lab was one of the most unique experiences I have had thus far in university, allowing me to bridge both my interest in medicine and computer science in order to gain valuable research experience. When I first began my journey, despite having a strong practical background in software development I had absolutely no previous exposure to machine learning nor high-performance computing.
 
As expected, beginning a research project in a field that you have no experience in is frankly not easy. I spent the first few months of the course trying to learn as much about machine learning algorithms and convolutional neural networks as I could; it was like learning to swim in an ocean. Thankfully, I had the support and guidance of my colleagues in the lab and my professor Dr. Tyrrell throughout the way. With their help, I pushed my boundaries and learned the core concepts of machine learning models and their development with solutions to real-world problems in mind. I finally had a thesis for my research.
 
My research thesis was to experimentally show a relationship that was expected in theory: smaller training sets tend to result in over-fitting of a model and regularization helps prevent over-fitting so regularization should be more beneficial for models trained on smaller training sets in comparison to those trained on larger ones. Through late nights of coding and experimentation, I used many repeated long-running computations on a binary classification model for dental x-ray images in order to show that employing L2 regularization is more beneficial for models training on smaller training samples than models training on larger training samples. This is an important finding as often times in the field of medical imaging, it may be difficult to come across large datasets—either due to the bureaucratic processes or financial costs of developing them.
 
I managed to show that in real-world applications, there is an important trade-off between two resources: computation time and training data. L2 regularization requires hyperparameter tuning which may require repeated model training which may often be very computationally expensive—especially in complex convolutional neural networks trained on large amounts of data. So, due to the diminishing returns of regularization and the increased computational
costs of its employment, I showed that L2 regularization is a feasible procedure to help prevent over-fitting and improve testing accuracy when developing a machine learning model with limited training data.
 
Due to the long-running nature of the experiment, I tackled my research project as not only a machine learning project but also a high-performance computing project as well. I so happened to be taking some systems courses like CSC367: Parallel Programming and CSC369: Operating Systems at the same time as my ROP399, which allowed me to better appreciate the underlying technical considerations in the development of my experimental
machine learning model. I harnessed powerful technologies like Intel AVX2 vectorization instruction set for things like image pre-processing on the CPU and the Nvidia CUDA runtime environment through PyTorch to accelerate tensor operations using multiple GPUs. Overall, the final run of my experiment took about 25 hours to run even with all the high-level optimizations I considered—even on an insane lab machine with an Intel i7-8700 CPU and an Nvidia GeForce GTX Titan X!
 
Overall, my ROP not only opened a door to the world of machine learning and high-performance computing for me but in doing so, it taught me so much more. It strengthened my independent learning, project management, and software development skills. It taught me more about myself. I feel that I never experienced so much growth as an academic, problem-solver, and software engineer in such a condensed period of time.
 
I am proud of all the skills I’ve gained in Dr. Tyrrell’s lab and I am extremely thankful for having received the privilege of working in his lab. He is one of the most supportive professors I have had the pleasure of meeting.
 
Now that I have completed my third year of school, I’m off to begin my year-long software engineering internship at Intel and continue my journey.
 
Signing out,

Adam
Adli

Squeezing in a Little Time for ML this Past Summer: John Valen’s Experience

My name is John Valen. Having recently completed my undergraduate degree in statistics and economics here at U of T, and soon moving on to pursue my Master’s in statistics in Europe, the Medical Imaging Volunteer Internship program seemed almost tailored to my goal of getting valuable research experience within a constrained time window. Over the course of only several months this summer, I’ve had the pleasant and enriching experience of contributing ideas and code to the project that summer ROP student Wenda Zhao undertook for the dentistry department at U of T, along with the guidance and contributions of ML lab leader Hershel Stark.

Wenda’s blog post (see here) neatly summarizes the goal of this project, one whose aim is to determine the likelihood that a misdiagnosis may occur, depending on the degree of damage to the dental plate being used for X-rays. Contributions I’ve helped make in particular include:

– Creating sparse matrix representations of the grey scale X-ray images themselves in order to economize on memory and run-time performance
– Hand-engineering features: once the artifacts (damage such as scratches, dents,
blotches, etc) were segmented out via DBSCAN, they were characterized by a variety of different metrics: size (pixel count), average pixel intensity (images are grey scale), location (relative to the center of the plate image), etc. 

– Training a K-Means algorithm to cluster segmented artifacts from the dental plate images based on these hand-engineered features, whereby clustering them in this unsupervised manner gave us insight on their properties;

And much more. If you are not familiar with this machine learning lingo, then do not worry; I was hardly exposed to it myself before I started working in this lab. I went in knowing close to nothing practical and a whole lot theoretical, and came out knowing quite a little more in the way of the first one. Fine, a lot more: or
so I like to think. It may not seem clear how my contributions can be used in the future to help answer the ultimate question. The truth is, nothing is really clear at the moment. The project is still on-going and I intend to keep up with it, making contributions remotely to it while I am away in Belgium pursuing my Master’s degree. This is the greatness of it all, the amount of flexibility we have in answering these questions leaves a lot of room for creativity and contemplation. 

All in all, from my own perspective (which has been greatly expanded over the course of the summer), the volunteer program was a perfect means to experience the sheer amount of work that is enthusiastically undertaken by serious students in answering these important questions. I hope that I too can now consider myself at the very least climbing to their ranks while I move on to other and more numerous serious pursuits in my life. 

Good luck to you all, and do not underestimate yourselves.


John Valen

Summer 2018 ROP: Wenda’s in the house!

Hello everyone, my name is Wenda Zhao. I’m starting my fourth year in September majoring in neuroscience and pathobiology. I did a research opportunity project (ROP) 399 course with Dr. Tyrrell this summer. And I’m here to share some of my experiences with you.
Today is a hot and humid Friday in southeast China, where I’m back home from school for the rare luxury of a short break before everything gets busy again. Summer is coming to an end, so is my time with Dr. Tyrrell and his incredible team, some of whom I have got to know, spent most of the summer working with and befriend. I have just handed in my report for the project I did over the past three months on the segmentation, characterization and superimposition of dental
X-ray artifacts.
And now, looking back, it was one of the best learning experiences I have ever had, through an enormous amount of self-teaching, practicing, troubleshooting, discussing and debating. As with all learning experiences, the process can be long and bewildering, sometimes even tedious; yet rewarding in the end.
 
It all began on a cold April morning, with me sitting nervously in Dr. Tyrrell’s
office, waiting for him to print out my ROP application and start off the interview. At that point, I just ended my one-year research at a plant lab and was clueless of what I was going to do for the following summer. Coming from a life science background, I went into this interview for a machine learning project in medical imaging knowing that I wasn’t the most competitive candidate nor the most suitable person to do the job. Although I tried presenting myself as someone who had had some experience dealing with statistics by showing Dr. Tyrrell some clumsy work I did for my previous lab, the flaws were immediately noticed by him. I then found myself facing a series of questions which I had no answers to and the interview quickly turned into what I thought to be a disaster for me. I was therefore very shocked when I received an email a week later from Dr. Tyrrell informing me that I had been accepted. I happily went onboard, but joys aside, part of me also had this big uncertainty and doubt that later followed me even to my first few weeks at the lab.
 
At the beginning, everything was new. I started off learning the software KNIME, an open-source data analytics platform that is capable of doing myriads of machine learning tasks. I had my first taste doing a classification problem, where we trained a decision tree model to identify a given X-ray to either be of a hand or a chest. It was a good introductory task to illustrate all the basic concepts in machine learning such as “training set”, “test set”, “input” and “output/label”. We ended up obtaining an accuracy of around 90% on the test set. That was the first time I witnessed the power of machine learning and I was totally amazed by it. I spent the next week or so watching more videos on the topic including state of the art algorithms such as convolutional neural network (CNN). While absorbing knowledge everyday was fun, I was at the same time a little lost about the future of my project. I began to realize that this experience is going to be very different from my past ones in wet labs, where a lot of the times you were already told what to do and all you need is to conduct the experiments and get the results. Here the amount of freedom that I have on my schedule, task and even the project itself was refreshing but at the same time terrifying. On retrospect, I considered myself lucky for that it was around that time of lost when the Faculty of Dentistry proposed a collaboration with us, which ended up being my project for the summer.
 
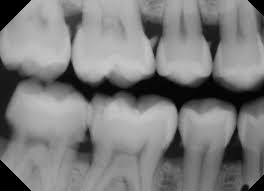
The dentistry project, as we so called, concerns a type of dental X-ray sensor called Phosphor Storage Plates (PSPs) which are very commonly used because of its easy placement in the oral cavity and the resulting minimum discomfort. The sensors, however, can accumulate damages over time, which would show up in the final image as artifacts with various appearances. Such artifacts could get in the way of diagnosis; thus, the plates need to be discarded before it’s too damaged. But how damaged is too damaged? For the moment, nobody has answers to that. Our goal is to use machine learning to learn the relationship between artifacts and whether they would affect diagnosis. Eventually, we can use that model to make predictions for a given plate and offer dentists advice as in when to discard it. The entire project is huge and the part we played in this summer mainly contributes as preparatory work. We segmented the artifacts from the image and clustered them into five groups based on 9 hand-engineered features. This characterization of the single artifacts can serve as the input for the model. We also created a library of superimposed images of artifact masks and real teeth backgrounds to mimic images taken with damaged sensors in real clinical settings. We did this so that dentists can take a look at these images and give a diagnosis. Comparing that with the true diagnosis, we can obtain the labels for whether a given artifact will affect diagnosis or not. And this will be the output of the model. The testing of these images is currently underway, and the results will be available in early September for further analysis.
 
With the project established and concrete goals ahead, the feeling of uncertainty
gradually went away. But it was never going to be easy. There were times when
we hit the bottleneck; when our attempts have failed miserably; when we had to give up on a brilliant idea because it didn’t go our ways. But
after stumbling through all the challenges and pitfalls, we found ourselves new. I was a bit lost at the beginning of this summer. But over the summer I learned
a lot about the very cool and growingly crucial field of machine learning; I grew a newfound appreciation for statistics and methodology; I picked up the programming language python, which I had been wanting to do for years and, most importantly, I did more thinking than I ever would if I were to just follow instructions blindly. And in the end, I believe that science is all about thinking. So for you guys out there reading the blog, if you’re coming to this lab from a totally different background and not entirely sure about the future, don’t be afraid. And I hope you find what you come here looking for, just like I did.
 
Finally, I want to thank the people who’s helped me along the way and who’s made the lab such an enjoyable place: Hershel, Henry, Rashmi, John and Trevor; and last but not least, Dr. Tyrrell, without whose kindly offer and guidance I would never have had such an amazing experience. Here’s to an unforgettable summer and a strong start of the new school year. Cheers!
 
Wenda Zhao