
In a neuron, long, tree-like appendages called dendrites receive chemical signals – either excitatory or inhibitory – from many different surrounding neurons. If the net signal received in the neuron’s cell body exceeds a certain threshold, then the neuron fires and the electrochemical signal is transmitted onwards to other neurons. Sure, this process is fascinating, but what does it have to do with statistics and machine learning?
Well, it turns out that the way a neuron functions – taking a whole bunch of weighted inputs, aggregating them, and then outputting a binary response – is a good analogy for a method known as logistic regression. (In fact, Warren McCulloch and Walter Pitts proposed the “threshold logic unit” in 1943, an early computational representation of the neuron that works exactly like this!)
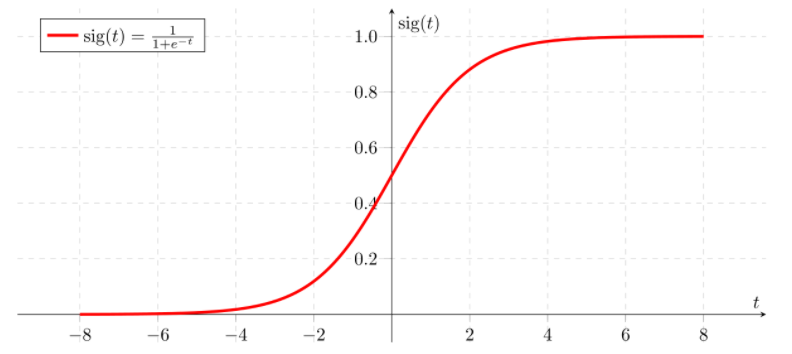
Perhaps you’ve heard of linear regression, which is used to model the relationship between a continuous scalar response variable and at least one explanatory variable. Linear regression works by fitting a linear equation to the data, or, in other words, finding a “line of best fit.” Logistic regression is similar, but it instead “squeezes” the output of a linear equation between 0 and 1 using a special sigmoid function. In other words, linear regression is used when the dependent variable is continuous, and logistic regression is used when the dependent variable is categorical.
Since the output of the sigmoid function is bounded between 0 and 1, it’s treated as a probability. If the sigmoid output for a particular input is greater than the classification threshold (for instance, 0.5), then the observation is classified into one category. If not, it’s classified into the other category. This ability to divide data points into one of two binary categories makes logistic regression very useful for classification problems.
Let’s say we want to predict whether a particular email is spam or not. We might have a dataset with explanatory variables like the number of typos in the email or the name of the sender. Once we fit a logistic regression model to this data, we can calculate “odds ratios” for each of the two explanatory variables. If we got an odds ratio of 2 for the variable representing the number of typos in the email, for example, we know that every additional typo doubles the estimated odds chance of the email being spam. Much like the coefficients in linear regression, odds ratios can give us a sense of a variable’s “importance” to the model.
Now let’s use “logistic regression” in a sentence.
Serious: I want to predict whether this tumour is benign or malignant based on several tissue characteristics. Let’s fit a logistic regression model to the data!
Less serious:
Person 1: I built a neural network!
Person 2: Hey – that’s cheating! You only used a *single* neuron, so you’re basically just doing logistic regression…
See you in the blogosphere!
Jacqueline Seal