Jacqueline Seal’s Journey in ROP299: Simulating clinical data!

Hi! My name is Jacqueline, and I’m going into my second year at U of T, pursuing a major in Computer Science and a specialist in Bioinformatics. This past summer, I had the opportunity to do a STA299 project with Professor Tyrrell through the Research Opportunity Program, and I’m excited to share my experiences here!

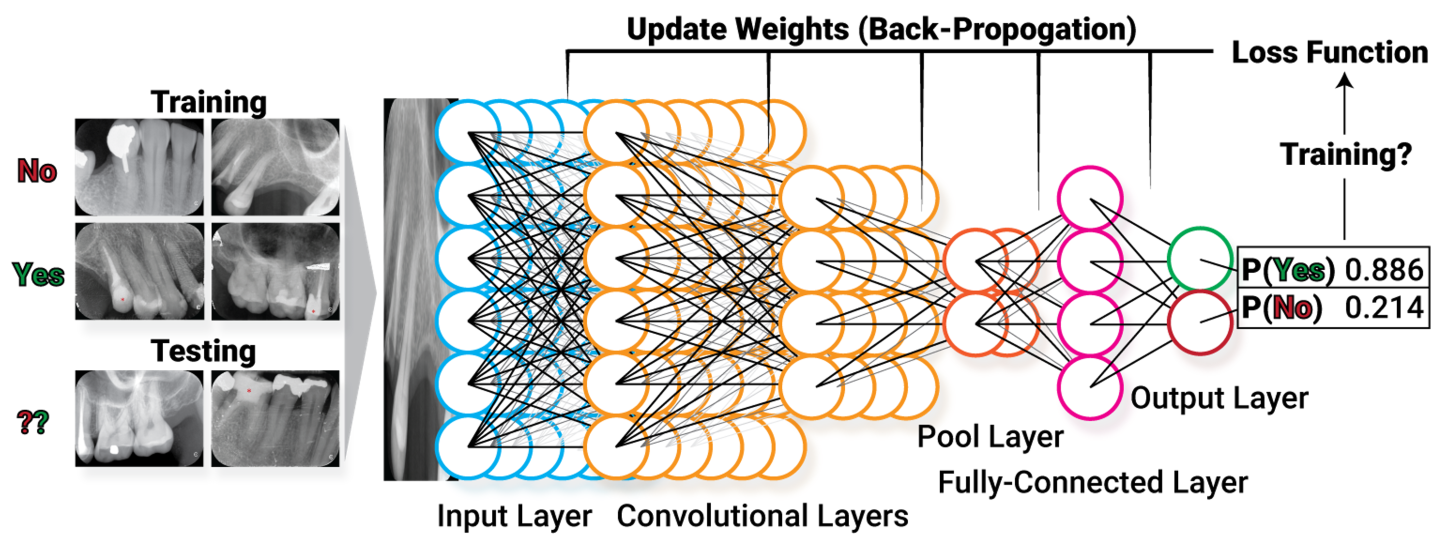
My ROP project for the summer dealt with the simulation of clinical variables relevant to detecting intra-articular hemarthrosis – basically bleeding into the joint – among patients with hemophilia, a disease where patients lack sufficient clotting proteins and are prone to regular, excessive bleeding. Since hemophilia is quite rare, clinical data is often unavailable and so simulation can help us understand what the real data might look like under different sets of plausible assumptions. The ultimate goal was to demonstrate that adding clinical data to Mauro’s existing binary CNN classifier for articular blood detection could boost model performance, as compared to a model trained exclusively on ultrasound images.

Having just completed first year, I went into this ROP with a very limited statistics background and was initially overwhelmed by all the stats jargon being used in lab meetings and in conversations with other lab members. Concepts like “odds ratios,” “ROC,” and “sensitivity analysis” were completely new to me, and I spent many hours just familiarizing myself with these fundamentals. 

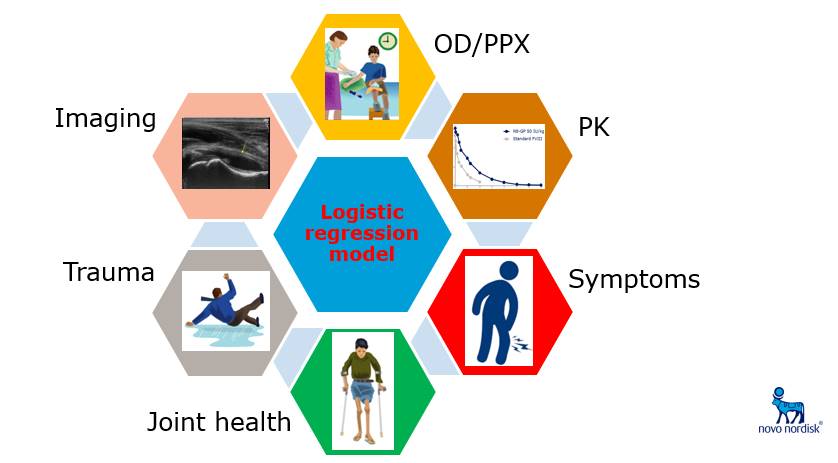
After a bit of a slow start, I began my project by identifying physical presentation and clinical history variables to use in my simulation. I was fortunate enough to speak with two distinguished hematologists from Novo Nordisk, Drs. Brand-Staufer and Zak, about the features most relevant to diagnosing a joint bleed. Based on this conversation, I selected two of these variables as a starting point and simulated them according to assumed distributions. Next, I simulated the probability of an articular bleed based on a logistic regression model and used that probability to simulate the “true” presence of a bleed based on a Bernoulli distribution.

Then, I took a bit of a fun detour: figuring out how to best match simulated data to real-world bleed probabilities output by Mauro’s model. With some guidance from Professor Tyrrell, I developed a matching algorithm that allowed us to control the strength of the positive correlation between clinical simulated probabilities and classifier probabilities. Perhaps the most difficult part of my project was ensuring that the simulated dataset captured the desired relationships between my explanatory variables and between each explanatory variable and the response variables. Thanks to the advice of Guan and Sylvia, however, I was able to verify these relationships and report on them in a statistically sound manner.

Despite all the obstacles I encountered along the way, despite changing the details of my methodology several times, despite making slow progress and occasionally feeling like I was going in circles, I’m very grateful to have had this opportunity. Not only did I gain a greater understanding of important statistical concepts and greater familiarity with machine learning techniques, but I also got first-hand experience navigating the research process, from beginning to end. Ultimately, my experience in the MiDATA lab was simultaneously challenging and rewarding, and I would like to thank Dr. Tyrrell for all his guidance this summer – whether it was setting up impromptu meetings to discuss unexpected issues in my data, providing feedback on my results, or simply sharing humorous anecdotes in our weekly lab meetings. Regardless of where this next year takes me, I’m confident that I’ll carry the lessons I learned this summer with me.

Jacqueline Seal

Dianna McAllister’s ROP Adventures in the Tyrrell Lab!

My name is Dianna McAllister and I am approaching the finish of my second year at University of Toronto, pursuing a bioinformatics specialist and computer science major. This year I was given the incredible opportunity to work in Dr. Tyrrell’s lab for the ROP299 course.
I have just handed in my first ever formal research paper for my work in Dr. Tyrrell’s lab. My project observed the effectiveness of using grad-CAM visualizations on different layers in a convolutional neural network. Though the end results of my project were colourful heat maps placed on top of images, the process to get there was not nearly as colourful or as effortless as the results may seem. There was lots of self-teaching, debugging, decision-making and collaboration that went on behind the scenes that made this project difficult, but much more rewarding when complete.
My journey in Dr. Tyrrell’s lab began when I first started researching ROP projects. I can still remember scrolling through the various projects, trying to find something that I thought I would be really passionate about. Once I happen upon Dr. Tyrrell’s ROP299, I could feel my heart skip a beat- it was exactly the research project that I was looking for. It explained the use of machine learning in medicine, specifically medical imaging. Being in bioinformatics, this project was exactly what I was looking for; it integrated biology and medicine with computer science and statistics. Once I saw this unique combination, I knew that I needed to apply.
After I applied, I was overjoyed that I had received an interview. When I attended the interview, I was very excited to show Dr. Tyrrell my interest in his research and explain how my past research would help me with this new project. But once I walked into his office, it was unlike any other interview I had ever had; he was able to point out things about myself that I had barely even realized and asked me many questions that I had no answer to. I remember walking out of that interview feeling disappointed as I thought that there was no way I would get a position in his lab, but a few weeks later heard back that I had gotten the position! I was delighted to have the opportunity to prove to Dr. Tyrrell that he made a good choice in choosing me for the position and that I would work hard in his lab and on my project.
The night before my first lab meeting, I researched tons of information on machine learning, making sure to have- what I thought- an in-depth understand of machine learning. But after less than five minutes into the lab meeting, I quickly realized that I was completely wrong. Terms like regression, weights, backpropagation were being thrown around so naturally, and I had absolutely no idea what they were talking about. I walked out of the meeting determined to really begin understanding what machine learning was all about!
Thus began my journey to begin my project. When I decided on my project, it seemed fun and not too difficult- all I have to do is slap on some heat maps to images, right? Well as much as I felt it wouldn’t be too difficult, I was not going to be deceived just as I had before attending our first meeting; and after completion I can definitely say it was not easy! The first problem that I encountered immediately was where to start. Sure, I understood the basic concepts associated with machine learning, but I had no experience or understanding of how to code anything related to creating and using a convolutional neural network. I was fortunate enough to be able to use Ariana’s CNN model. Her model used x-rays of teeth to classify if dental plates were damaged and therefore adding damage (artifacts) to the x-rays of teeth or if the plates were functional. It took me quite some time to understand what each line of code did within the program- the code was incredible, and I could not imagine having to write it from scratch! I then began the code to map the grad-CAM visualizations (resembling heat maps) onto the images that Ariana’s model took as input. I was again fortunate enough to find code online that was similar to what I needed for my project. I made very minor tweaks until the code was functional and worked how I needed it to. Throughout this process of trying to debug my own code or figure out why it wouldn’t even begin running, Mauro was always there to help, always being enthusiastic even when my problem was as silly as accidentally adding an extra period to a word.
Throughout the process, Dr. Tyrrell was always there as well- he always helped me to remember the big picture of what my project was about and what I was trying to accomplish during my time in his lab. This was extremely valuable, as it kept me from accidentally veering off-course and focusing on something that wasn’t important to my project. Without his guidance, I would have never been able to finish and execute the project in the way that I did and am proud of.
Everything that I learned, not only about machine learning, but about how to write a research paper, how to collaborate with others, how to learn from other’s and your own mistakes and how to keep trying new ideas and approaches when it seems like nothing is working, I will always carry with me throughout the rest of my undergraduate experience and the rest of my professional future. Thank you, Dr. Tyrrell, for this experience and every opportunity I was given in your lab.
Dianna McAllister

Wendi in ROP399: Learning How the Machine Learns…and Improve It!


Hi everyone! My name is Wendi Qu and I’m finishing my third year in U of T, majoring in Statistics and Molecular Genetics. I did a ROP399 research project with Dr. Pascal Tyrrell from September 2018 – April 2019 and I would love to share it with you!
 
Artificial intelligence, or AI, is a rapidly emerging field becoming ever so popular nowadays, with exponentially increasing research published and companies established. Applications of AI in numerous fields has greatly improved efficacy and convenience, including facial recognition, natural language processing, medical diagnosis, fraud detection, just to name a few. In Dr. Tyrrell’s lab in the Department of Medical Imaging, the gears have been gradually switched from statistics to AI in the past two years for research students. With a Life Science and Statistics background, I’ve always been keen on learning the applications of statistics/data science in various medical fields to benefit both doctors and patients. Having done my ROP299 in Toronto General Hospital, I realized how rewarding it was to use real patient data to study disease epidemiology and how my research can help inform and improve future surgical and clinical practices. Therefore, I was extremely excited when I found out Dr. Tyrrell’s lab and really grateful for this amazing opportunity, where I can go one step further and do AI projects in the field of medical imaging.
 
Specifically, my projects focused on how to mitigate the effect of one of the common problems in machine learning – class imbalance. So, what is machine learning? Simply put, we feed lots of data to a computer, which has algorithms that find patterns in those data and use such patterns to perform different tasks. Classification is one of the common machine learning tasks, where the machine categorizes data to different classes (eg. categorizes an image to “cat” when shown a cat image). A common problem in medical imaging and diagnosis is that there’s way more “normal” data than “abnormal” ones. A machine learning model predicts more accurately when trained on more data, and the shortage of “abnormal” data, which are the most important ones, can impair the model’s performance in practice. Hence, finding methods to address this issue is of great importance. My motivation for doing this project largely comes from how my findings can offer insights on how different methods behave when training sets have different conditions, such as the severity of imbalance and sample size, which can be potentially generalized and help better implement machine learning in practice.
 
However, as with any research project, the journey was rarely smooth and beautiful, especially when I started with almost zero knowledge in machine learning and Python (us undergraduate statisticians only use R…). Starting off by doing a literature search, I realized many methods have been suggested to rectify class imbalance, with two main approaches being re-sampling (i.e. modify the training set) and modifying the cost function of the model. Despite many research done on this topic, I found that such methods were almost never studied systematically to assess their effect on training sets of different natures. The predecessor of this project, Indranil Balki, studied the effect of the class imbalance systematically by varying the class imbalance severity in a training set and see how model performance can be affected. Building on this, I decided to apply different methods to such already established imbalanced datasets and test for model improvement. Because more data lead to better performance, I was also curious if there’s a difference in how much different methods can improve the model in smaller and larger training sets.
 
One of the hardest parts of the project was making sure I was implementing the methods appropriately, and simply writing the code to do exactly what I want it to do. The latter part sounds simple but becomes really tricky when dealing with images in a machine learning context, and is again, even more challenging if you know nothing about Python… ! After digging into more literature, consulting “machine learning people” in the lab (a big shoutout to Mauro, Ahmed, Ariana, and of course, Dr. Tyrrell), I was able to develop a concrete plan, where I implement oversampling methods via image augmentation only when the imbalanced class has fewer images than other classes, and apply under sampling only when imbalanced class has more images; class weights in the cost function will also be adjusted as another method.
 
However, implementing them was a huge challenge. I self-learned Python by taking courses in Python, machine learning, image modification, random forest model, and anything that’s relevant to my project on Datacamp, a really useful website offering courses in different coding languages. Through this process and using Indranil’s code as a skeleton, I was finally able to implement all my methods and output the model’s prediction accuracy! It was a long, painful process which involved constant debugging, but it was never more rewarding to see the code finally run smoothly and beautifully!
 
This wonderful journey has taught me many things – not only have I taken my first step in machine learning, it again reminded me of the most valuable part of doing research, which combines independence, creativity, self-drive, and collaboration. Deciding on a topic, finding a gap, developing your own creative solutions, being motivated to learn new things and conquer challenges, and collaborating with intelligent people surrounding you, are the most invaluable experiences for me this year. Finally, I would love to thank all the amazing people in the lab, especially Mauro, whose machine learning knowledge, coding skills and humour were always there with me, and Dr. Pascal Tyrrell, with more questions back to us when we come with a question, enlightening advice, and a great personality. I appreciate
his amazing experience, and it has inspired me to delve deeper into machine learning and healthcare!
 
Wendi Qu


Rachael Jaffe’s ROP Journey… From the Pool to the Lab!

https://thevarsity.ca/2019/03/10/what-does-a-scientist-look-like/
My name is Rachael Jaffe and I am completing my third year in Global Health, Economics and Statistics. I had no clue what I was getting myself into this year during my ROP (399) with Dr. Tyrrell. I initially applied because the project description had to do with statistics,
and I was inclined to put my minor to the test! Little did I know that I was about to embark on a machine learning adventure.
My adventure started with the initial interview: after a quite a disheartening tale of Dr. Tyrrell telling me that my grades weren’t high enough and me trying to convince him that I would be a good addition to the lab because “I am funny”, I was almost 100% certain that I
wasn’t going to be a part of the lab for 2018-2019 year. If my background in statistics has taught me anything, nothing truly has a 100% probability. And yet, last April I found myself sitting in the department of medical imaging at my first lab meeting.
Fast forward to September of 2018. I was knee deep (well, more accurately, drowning) in machine learning jargon; from learning about the basics of a CNN to segmentation to what a GPU is. From there, I chose a project. Initially, I was just going to explore the relationship between sample size and model accuracy, but then it expanded to include an investigation in k-fold cross validation.
I started my project with the help of Ariana, a student from a lab in Costa Rica. She built a CNN that classifies dentistry PSP’s for damage. I modified it to include a part that allowed the total sample size to be reduced. The relationship between sample size and model accuracy is very well known in the machine learning world, so Dr. Tyrrell decided that I
should add an investigation of k-fold cross validation because the majority of models use this to validate their estimate of model accuracy. With further help from Ariana’s colleague, Mauro, I was able to gather a ton of data so that I could analyze my results statistically.
It was more of a “academic” project as Dr. Tyrrell noted. However, that came with its own trials and tribulations. I was totally unprepared for the amount of statistical interpretation that was required, and it took a little bit of time to wrap my head around the intersection of statistics and machine learning. I am grateful for my statistics minor during this ROP because without it I would’ve definitely been lost. I came in with a knowledge of python so writing and modifying code wasn’t the hardest part.
I learned a lot about the scientific process during my ROP. First, it is incredibly important to pick a project with a clear purpose and objectives. This will help with designing your project and what analyses are needed.  Also, writing the report is most definitely a process. The first draft is going to be the worst, but hang on because it will get better from there. Lastly, I learned to learn from my experience. The most important thing as a budding scientist is to learn from your mistakes so that your next opportunity will be that much better.
I’d like to thank Dr. Tyrrell for giving me this experience and explaining all the stats to me. Also, Ariana and Mauro were invaluable during this experience and I wish them both the best in their future endeavors!

Rachael Jaffe

Adam Adli’s ROP399 Journey in Machine Learning and Medical Imaging

My name is Adam Adli and I am finishing the third year of my undergraduate studies at the University of Toronto specializing in Computer Science. I’m going to start this blog post by talking a little bit about myself. I am a software engineer, an amateur musician, and beyond all, someone who loves to solve problems and treats every creation as art. I have a rather tangled background; I entered university as a life science student, but I have been a programmer since my pre-teen years. Somewhere along the way, I realized that I would flourish most in my computer science courses and so I switched programs in at the beginning of my third year.
 
While entering this new and uncertain phase in my life and career, I had the opportunity of meeting Dr. Pascal Tyrrell and gaining admission to his research opportunity program (ROP399) course that focused on the application of Machine Learning to Medical Imaging under the Data Science unit of the Department of Medical Imaging.
 
Working in Dr. Tyrrell’s lab was one of the most unique experiences I have had thus far in university, allowing me to bridge both my interest in medicine and computer science in order to gain valuable research experience. When I first began my journey, despite having a strong practical background in software development I had absolutely no previous exposure to machine learning nor high-performance computing.
 
As expected, beginning a research project in a field that you have no experience in is frankly not easy. I spent the first few months of the course trying to learn as much about machine learning algorithms and convolutional neural networks as I could; it was like learning to swim in an ocean. Thankfully, I had the support and guidance of my colleagues in the lab and my professor Dr. Tyrrell throughout the way. With their help, I pushed my boundaries and learned the core concepts of machine learning models and their development with solutions to real-world problems in mind. I finally had a thesis for my research.
 
My research thesis was to experimentally show a relationship that was expected in theory: smaller training sets tend to result in over-fitting of a model and regularization helps prevent over-fitting so regularization should be more beneficial for models trained on smaller training sets in comparison to those trained on larger ones. Through late nights of coding and experimentation, I used many repeated long-running computations on a binary classification model for dental x-ray images in order to show that employing L2 regularization is more beneficial for models training on smaller training samples than models training on larger training samples. This is an important finding as often times in the field of medical imaging, it may be difficult to come across large datasets—either due to the bureaucratic processes or financial costs of developing them.
 
I managed to show that in real-world applications, there is an important trade-off between two resources: computation time and training data. L2 regularization requires hyperparameter tuning which may require repeated model training which may often be very computationally expensive—especially in complex convolutional neural networks trained on large amounts of data. So, due to the diminishing returns of regularization and the increased computational
costs of its employment, I showed that L2 regularization is a feasible procedure to help prevent over-fitting and improve testing accuracy when developing a machine learning model with limited training data.
 
Due to the long-running nature of the experiment, I tackled my research project as not only a machine learning project but also a high-performance computing project as well. I so happened to be taking some systems courses like CSC367: Parallel Programming and CSC369: Operating Systems at the same time as my ROP399, which allowed me to better appreciate the underlying technical considerations in the development of my experimental
machine learning model. I harnessed powerful technologies like Intel AVX2 vectorization instruction set for things like image pre-processing on the CPU and the Nvidia CUDA runtime environment through PyTorch to accelerate tensor operations using multiple GPUs. Overall, the final run of my experiment took about 25 hours to run even with all the high-level optimizations I considered—even on an insane lab machine with an Intel i7-8700 CPU and an Nvidia GeForce GTX Titan X!
 
Overall, my ROP not only opened a door to the world of machine learning and high-performance computing for me but in doing so, it taught me so much more. It strengthened my independent learning, project management, and software development skills. It taught me more about myself. I feel that I never experienced so much growth as an academic, problem-solver, and software engineer in such a condensed period of time.
 
I am proud of all the skills I’ve gained in Dr. Tyrrell’s lab and I am extremely thankful for having received the privilege of working in his lab. He is one of the most supportive professors I have had the pleasure of meeting.
 
Now that I have completed my third year of school, I’m off to begin my year-long software engineering internship at Intel and continue my journey.
 
Signing out,

Adam
Adli

Lee Radigan: A Reflection on my (6th) Year as an Undergrad at the University of Toronto

My name is Lee Radigan and I am a non-degree student pursuing admittance to the Biostatistics Masters program at the Dalla Lana School of Public Health.  After returning for my 6th year studying statistics at The University of Toronto, I thought that this was a perfect time to reflect on my progress.
Since September, I have been working under Dr. Pascal Tyrrells guidance on a project aimed at helping the Department of Medical Imaging report agreement in their research.  To do this, I created a flow chart to help guide the reader towards the proper method of agreement.  Along with this, I conducted a simulation looking at a specific question pertaining to the Department.
Initially, I was tasked with combing through various papers on the theory of agreement and making sense of all the different published work that was out there.  There are many different approaches and different ways of looking at reporting agreement, so it was quite difficult to figure out when and where to properly use every single approach.  After reading and re-reading each paper, as well as consulting the MiData team, I started to develop a thorough understanding of what agreement was, why it is important to report it, and how to go about reporting it appropriately.
Next, a flow chart was required to summarize what I had learned from the literature.  This was not an easy task, because it forced me to dig really deep and make sure that every node in my flow chart was well thought out and appropriate.  After many iterations and adjustments, I created a detailed chart that walks the reader from their initial research question up to the required agreement statistic.
My final task was to conduct a simulation that would test the question: Can a group of less experienced student raters be as accurate as a smaller set of more experience expert raters?  And if so, how many students?  And under what conditions?  This was a very fun and informative task for me as I was able to conduct my first simulation.  During this experience, my biggest difficulty was justifying my choices of parameters within the simulation.  When conducting a simulation you have freedom to choose how it is going to work, but you must be careful to be able to back up each and every parameter choice.  The simulation ended up showing that: the larger the disparity between the rating errors of the student and expert raters, the more students it takes to match the accuracy of the experts, confirming my intuition.
There are many things that I wish to expand on with respect to my project in future.  I want to create a user friendly app that will be even easier and more compact than my flow chart.  Additionally, I want to try to get my paper published.  To do this I will need to look further into my simulation and consider a more broad range of student/expert scenarios that likely will occur in practice.  I will also need to further refine my definitions and understanding of each concept of agreement.
This year has truly been the best of my life and I can largely attribute that to Dr. Pascal and the MiData team.  I look forward to contributing to Medical Imaging research and to many more learning experiences.
Time to enjoy the summer as I embark on yet another exciting experience as a student Statistical Analyst at the CAMH Nicotine Dependence Clinic as a summer placement!
Lee Radigan