So, in my last post I introduced F.I.N.E.R. as a convenient way to remember what makes a good research question. We covered F for feasible and today we will go over I for Interesting.
What is important when dreaming up a research question is to make sure that you are interested and engaged. This is what will provide you with the energy, drive, and determination to overcome the many hurdles and frustrations that will invariably stand in you way on your path during the research process.
Gwen may have No Doubt about what she is interested in. But do you? How will you gauge how interesting your question is? Easy – talk to people about it. One of the problems new researchers have with their research questions is that they Don’t Speak (great song!) with others during the planning process. Ask as many mentors, experts, family members, friends, colleagues as you can about your question. All that feedback will help you determine whether it is worth your precious time and effort to pursue that research.
Don’t be shy to ask people their opinion and don’t be take it personally if you get negative feedback. It is all part of the process. You can’t expect to have everyone interested but you can certainly try your best to have many.
 Try early on in your research career to find a Person of Interest (well maybe not that kind of person) or someone who you value their opinion and are friendly with to act as a sounding board to your ideas before you move on outside the “inner-circle”. You can even repay the favor to them for their research endeavors. Hint: choose wisely…
Next is N…
See you in the blogosphere,
Pascal Tyrrell
What Makes a F.I.N.E.R. Research Question? F is for…
…Fugitive? Well that is certainly how you can feel when out with your friends and knowing you should be home studying for your upcoming stats 101 exam. Not sure how that feels? Watch the trailer from the fantastic movie The Fugitive.
 Now that you are well versed in dreaming up research questions and driving everyone around you nuts, I thought I would chat a little about how you can assess whether you have a good one “on the line” or a stinker.
A great mnemonic suggested by Hulley et al is F.I.N.E.R. and suggests that research questions need to be feasible, interesting, novel, ethical, and relevant. Today we will talk about the first one.
F is for FEASIBLE. When you are creating a research question you must always ask yourself: “Can I answer this question?”. There are many reasons that may stop you from completing your quest to answer a given question. Maybe not as dramatic as in the Quest for Camelot, but it is important to take note of your limitations:
1- Do you or other members of your team have the know-how or technical expertise to plan, execute, and analyze the study required to answer your question? Maybe you need to brush up on your skills before embarking on your adventure… or phone a friend!
2- Can you afford the time to complete your quest? Do you have the money to pay for it? Gold wins wars not soldiers (Game of Thrones season 1)! Always plan ahead so that your study does not get compromised or cancelled because you don’t have the money or the time to continue (summer student projects often fall pray to this).
3- Do you have access to enough subjects to appropriately power your study? Sample size calculation is a fun and challenging topic and we will address this in later posts. If you want to know how many of your classmates – say 100 – want to go camping over the weekend to celebrate the end of the school year, how many should you ask before you are confident it will be worth your effort to organize the trip? All of them? Some of them? But how many…
4- Are you asking too much at once? Is the scope of your research question too broad? Focus on the most important goals.

Don’t become a “Jack of all trades and master of none“! Aim for a better answer to the main question that you are interested in.
Next post we will move on to I…
See you in the blogosphere,
Pascal Tyrrell
The Order in K-OS and Who’s Dog Is It?
Did you know that Einstein is also known to have contributed significantly to statistical physics? In 1905, he proposed an explanation for the phenomenon called Brownian motion – named after the botanist Robert Brown who first described the process. Essentially, particles suspended in a fluid (liquid or gas) exhibit a random motion (path) resulting from their collision with the quick atoms or molecules in the gas or liquid. This is the K-OS or more appropriately “chaos” of the process. Have a listen to The Dog Is Mine from K-OS to get you ready for some Einstein talk.
The problem with understanding Brownian motion is that the molecules are too light to move the floating particle and molecular collisions occur way more frequently than the observed jiggles.
What is the take home message? That much of the order we perceive in the world around us is dependent on an invisible underlying disorder. Words of caution: though random variation can lead to orderly patterns, these patterns are not always meaningful. (See previous posts: Rebel Without a Cause and What Does the Fox Say for some hints on how not to be fooled)
So what is the link between Einstein and The Dog is Mine K-OS song? The dog named Einstein from the Back to the Future movie, of course!
See you in the blogosphere,
Pascal Tyrrell
What Does The Fox Say?
I have often talked about “inferential statistics” in this blog. Don’t remember? Have a quick peek here If Only I Had a Brain and here It’s Cold Out Today – Please Remember to Dress Your Naked P-Value.
Back in the saddle? OK. Lately, I have had the pleasure of addressing young minds (shout out to CAGIS who were AWESOME on Saturday at our Sunnybrook Health Science Center presentation) and I thought I might talk a little about what “inferential” means to statistics.
So What Does The Fox Say? And does Ylvis have the answer? Listen to the song while you read through the rest of the post. We live in a crazy complex world that is largely random and uncertain. This is a good thing as it would be mighty boring to know how everything will turn out in the future. Imagine sitting in the middle of the forest and counting and recording the sounds of ALL animals that pass you – by species! Wow, that’s a lot of data. Now as new research scientists (don’t forget to wear your Pocket Protector before heading out into the woods!) we like ways to describe and make sense of what we observe – we simply want to understand the world better or maybe we are working on a answer to our newly minted Research Question.
Either way you are certainly thinking where does the randomness and uncertainty come into all this? Well, it exists in two places:
1- Most importantly, in the process of what you are interested in studying.
2- But also in how we collect our data (collection and sampling methods).
So you now have an incredible amount of data in your spreadsheet or on little pieces of paper in a shoe box. What now? You have gone from the world around you to data in your hand. You need to somehow capture the essence of all of your data and turn it into something more concise and understandable. You do this by finding “statistical estimators” which means performing appropriate statistical analyses. The results from these analyses will allow you to estimate, predict, or give your “best educated guess” at the answer to your research question.
So by going from the world to your data, and then from your data back to the world is what we call statistical inference.
For example after collecting many days worth of data in the woods, you find that all “furry” creatures make a a kind of barking sound whereas all “feathered” creatures chirp. Excited, you tell your friends that the next time that they are in the woods and they see a furry creature they can expect to hear them bark. However, we do not know that for sure and this is where the uncertainty creeps in.
Ylvis seems to think the fox says:”Ring-ding-ding-ding”. Maybe his data collection and sampling technique was different to yours. This contributes to error and we will talk about this in a later post.
Hopefully you do not feel like you are in the movie “Inception” and… we’ll see you back in the blogoshere soon.
Pascal Tyrrell
Baby Steps and What About Bob?
I had the pleasure of addressing the students from the SciTech program at Tomken Middle School last week. Bright, enthusiastic, and interested in science… all 165 of them! I was there to talk about our sister program – Medical imaging Buddies. Remember the MiB movies? Very funny. Have a quick peek for fun. I’ll wait here.
So the question is always: “what do I do to get started?”. Believe it or not this applies to whether you are a 10 year old SciTech student or a radiologist on faculty with our department. I have been doing this for a while and I would like to share some encouraging suggestions that you may find helpful:
- Read this blog! OK, so I am shamelessly promoting my own program. But it is a perfect place to start. Easy reading, no commitment, anonymous, informative, and best of all FREE! Look for more resources like this one.
- As you are thinking about what has been said in the various posts think of what a next step could be that would move you closer to your goal of becoming a research scientist and at the same time not trigger a fight or flight response. Take Baby Steps just like in the movie What About Bob? What a hilarious movie but the small steps to slowly move you forward is no joke.
- Start telling people about who you are becoming. Share with them some of your achievable and positive goals. This way they will be able to encourage you when you need a little push AND be proud of you when you succeed.
- Don’t be afraid of failure. It is simply an unwanted outcome. So what. Learn from it and move on.
- Finally, don’t be a silo (unless you are Bruce Cockburn and singing If I had a Rocket Launcher). Be a team player. Remember to always bring something of value to your team. At first, this may just simply be positive energy and enthusiasm – good enough for my team!
Rebel Without a Cause… Or Maybe?
OK, enough with stats. Let’s talk a little about causality. You have been patiently wearing your pocket protector for a couple of months, asking the right questions all the time, and diligently reading this blog to glean as much information as possible to become a research scientist.
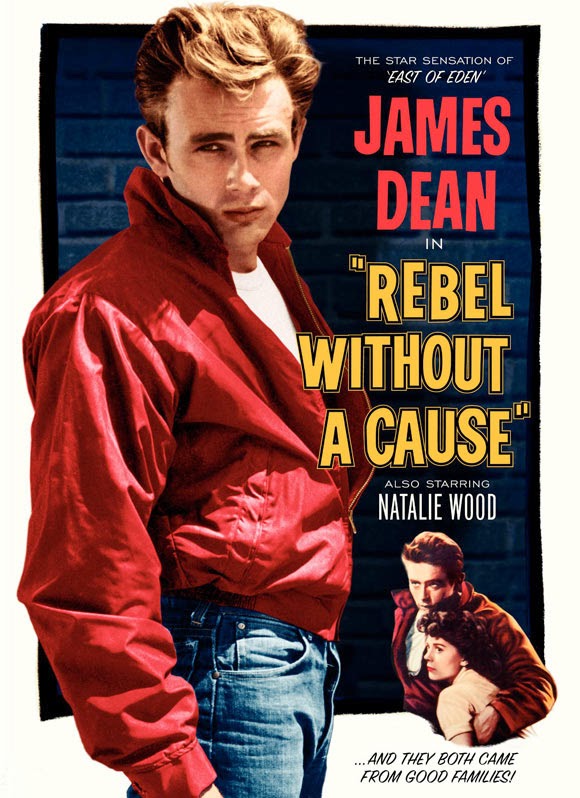
So what now? Do you feel a little like a Rebel Without a Cause? You are asking questions that are interested in describing an association of interest. How about the association between watching horror movies and myocardial infarction (MI). One possibility is that watching horror movies is the cause-effect of an MI. You’re thinking: sure but there must be other explanations. You are right! Actually there can be another 4 rival explanations:
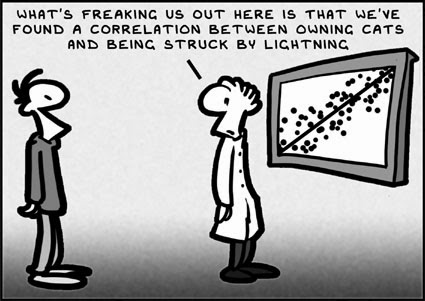
1- By chance alone you observed an association in your data. This is a spurious association.
3- Effect – cause: having an MI is the reason (cause) for watching horror movies – reverse to what you were thinking.
4- Confounding: watching horror movies is associated with a third factor that is the cause of MI. Say eating all those unhealthy snacks during the movie.
And of course don’t forget your initial “gut feeling” cause-effect: watching horror movies is a cause of MI.
Phew! That is a lot to think of. So what is important to remember? When designing your study to answer your question, you must always consider how to avoid spurious associations and concentrate on ruling out real associations that do not represent cause-effect. Especially those due to confounding.
Take a break and watch the Chicken Game from Rebel Without a Cause and then listen to Rebel Music to calm down after the game of chicken. So is playing chicken with cars hurtling towards a cliff associated with death? Possibly. But in watching the clip you see that maybe there is a confounding factor… See it?
Until next time in the blogosphere,
Pascal Tyrrell
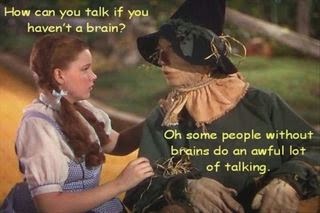
If Only I Had A Brain…
So how was March break? My family and I went to Stowe, Vermont for a little skiing. Awesome. However, the 8 hour drive with 3 kids, our luggage, skis, snowboards, and snacks to get there… maybe not so much. We felt a little like Dorothy in the The Wizard of Oz.
Last time we were talking about p-values and inferential statistics (see Naked p-value if you don’t remember) and I mentioned that I would talk a little more about hypothesis testing. Now Ronald Fisher believed that if you obtained a large p-value when performing a statistical test then you would reject the null hypothesis. So the null hypothesis is always assumed to be true until shown to be false with a statistical test. This helps you determine the probability of seeing an effect as big or bigger than that in your study by chance alone if the null hypothesis were true. This is called significance testing.
Here is an interesting thought: in many (most?) situations the statistical test you perform for the your study is to test the null hypothesis that no difference in effect exists between groups. In our previous example we were interested in whether gals or guys are associated with whether they like the Naked Gun movies or not in the population of blog readers. If no difference truly existed between gals and guys then why perform the study? The null hypothesis that both gals and guys equally like the Naked gun movies is a “straw man” meant to be knocked down by the results of your study. Therefore, you should always maximize the power of your study in order to knock down the straw man and show a difference exists between gals and guys.
Ok. Now that we have worked up a sweat knocking down Scarecrow from the Wizard of Oz, cool down listening to Long December (yes, I am happy spring is around the corner) from the Counting Crows and…
I’ll see you next time in the blogosphere.
Pascal Tyrrell
It’s Cold Out Today – Please Remember to Dress Your Naked P-Value…
Ok, so you agree to dress your little friend before sending him/her out into the cold world of publication. But what is a p-value anyway? I realize that I am jumping the gun (pun intended) a little as it forces us to talk about inferential statistics – a challenging topic. So today I will only give you a small taste of what is to come. First, to get you in a good mood I want you to watch the trailer for the first of three hilarious Naked Gun movies.
We have already talked about research questions and today I would like to introduce you to their children the research hypotheses. Essentially they are a version of their parents that summarize the main elements of a study – sample, predictor and outcome variables – in such a way that you are able to perform a test of statistical significance. These hypotheses are not required for descriptive studies like the ones we have been discussing in our blog so far. For instance if we were to ask how many people who read this blog enjoyed the Naked Gun series of movies we would end up with a proportion. We could then simply describe our findings as discussed in my Ogive post.
But what if you wanted to now if the proportion of gals differed from the proportion of guys who enjoyed the movies as you suspect that the type of humor will please guys more than gals? As we are research scientists we would want to test this “hypothesis” in order to compare the findings among the groups: this is a test of statistical significance. The brilliant statistician Ronald Fisher championed this approach. Only a single hypothesis is required: the null hypothesis. It simply states that no association of interest exists. So in this case whether you are a gal or a guy is not associated with whether you like the Naked Gun movies or not in the population of blog readers.
Break! Listen to the music of P-value Diddy (he has so many names already I thought it ok to add one more) with Jimmy page from the Godzilla soundtrack.
Welcome back. So the null hypothesis is always assumed to be true until shown to be false with a statistical test. When you analyze your data and perform the test you will determine the probability of seeing an effect as big or bigger than that in your study by chance alone if the null hypothesis were true. You would reject the null hypothesis if the p-value is less than a predetermined level of significance – typically 5% or 1 in 20.
So what is a naked p-value? It is simply a p-value obtained from the statistical test you performed on the data from your study reported WITHOUT an effect size, its sign and precision. The effect size is simply an estimate of the size of the association that you are studying – 25% more guys liked the movies as compared to the gals. The sign and precision is simply the direction of the observed difference (are you comparing gals to guys or the other way around) and an estimate of how confident you are – generally reported as a confidence interval which we will talk about in a later post.
So what is the bottom line? In order to keep your p-value warm you need to report it with the measure of the size of the association (effect size) and how confident you are about your answer.
In a subsequent post we will talk about another similar approach, Pearson-Neyman hypothesis testing, which involves two competing hypotheses (the null and the alternate hypotheses). This approach is duductive as opposed to Fisher’s inductive statistical testing approach. Both approaches are valid. It is simply a matter of determining which is more appropriate in a given situation.
See you in the blogosphere,
Pascal Tyrrell
Are You My Type, Data?
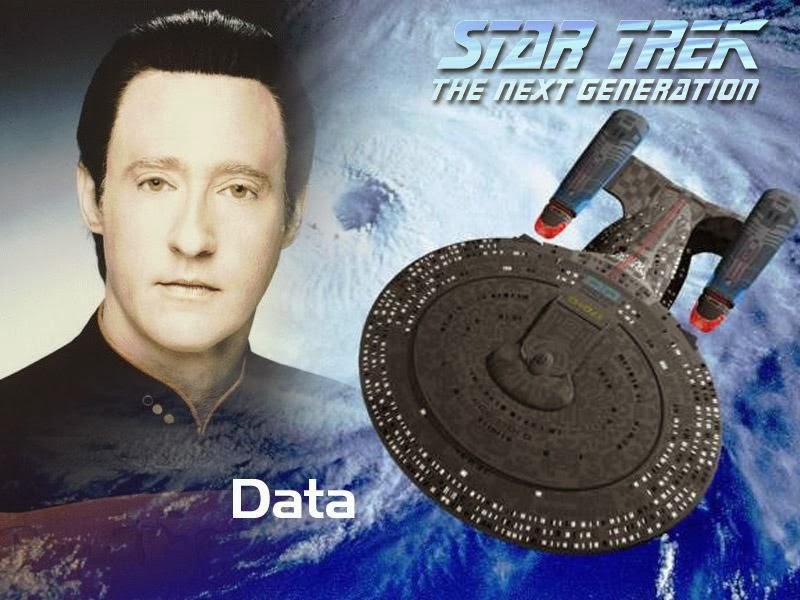
So you have come up with a research question and now you must chose a method by which your responses will be obtained. For example, a question like ‘Are you a Trekky?’ leads to a simple yes/no answer. So, are you? No need to fess up. I understand. Don’t know what I am talking about? See the trailer for my favorite of the Star Trek movies: The Wrath of Khan Trailer.
What if you were to ask, ‘How much of a Trekky are you?’. You are no longer able to use a simple two-category response but one that uses a continuous scale.
An important distinction to remember when dealing with responses in research is that in general some will be categorical, such as favorite TV series, race, or marital status, and others continuous variables like blood pressure, cholesterol levels, or how much you enjoy Star Trek shows on a scale of 1 to 10 recorded on a 100 mm line. For those of you who would score high here listen to Santana – You are my kind as a reward.
This brings us to the important concept of the level of measurement. If you are working with named categories – race for example – then you have a nominal variable. Categories that have an order to them – education level for example – are ordinal variables. What if the interval between your responses is fixed and known? Then you have an interval variable – temperature in Celcius or Fahrenheit is a good example. However, is zero degrees Celcius the same as zero degrees Fahrenheit? No. The latter is much colder! Now what if you are working in Kelvin which has a meaningful zero point? Then it is a ratio variable.
Ok, so why the big deal? The important difference is between nominal/ ordinal data and interval/ ratio data. The latter two can be used in what is termed: “parametric statistics” that gives us measures of center (mean) and spread (standard deviation). We have already touched on this in previous posts. See here: Great Expectations. It makes no sense to talk about the average sex of a sample students in your study. These data must be considered as frequencies in separate categories. We previously talked about this a little here: Ogive and this type of data leads to “non-parametric” analysis.
Enough already! I’ll let you get back to streaming Star Trek re-runs…
Next time lets talk a little about parametric statistics and how thy came to be. I’ll leave you with this quote as a teaser from one of the greatest statisticians to ever walk the earth – Ronald Fisher: “The analysis of variance is not a mathematical theorem, but rather a convenient method of arranging the arithmetic.”
Pascal Tyrrell

