Ogive? What the what? Oh, “jive”… right!

Ahhh, the 80’s. Interesting years to be in high school. I think I never quite fully recovered. I don’t wear Corduroy pants anymore but the acid wash jean jacket… maybe. Not sure what I am talking about? Have a peek here:  80’s-fashion.


So in my last post we talked about the concept of expectation (see Great-expectations) and the importance of organizing our data. Ask me what I think is the most important step to understanding your data? Organizing and graphing it – always. It is such a simple thing to do and yet it gives you crazy perspective and insight for any analysis that may follow. 


The concept of a frequency distribution in statistics is paramount. By organizing your data values into an appropriate number of classes we in fact make more explicit the information that is there in the data. The resulting frequency table can then provide us with some basic summary statistics such as class frequencies and proportions. By the way, classes have end marks. The upper and the lower. The average of these two marks is the mid-point and the interval is the difference between adjacent class mid-points. Lastly, the class mid-point plus or minus half the interval gives you the class boundaries… Boring? Maybe you need a break. Watch the trailer for the epic 1980 movie Airplane! to decompress a little: Airplane! movie trailer…


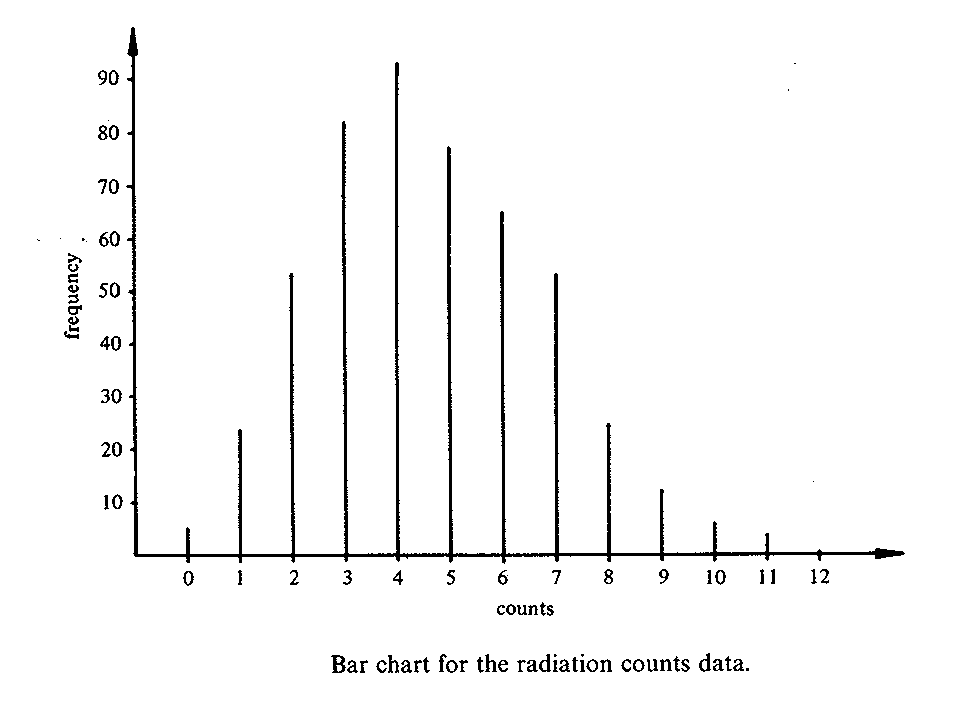
So what now? We need to present this data graphically. The first chart to think of is the bar chart. It is simply a plot of the frequency against class, where the class frequencies are represented by bars. Classes in this case are made up of SINGLE readings. How about an example using radiation counts?


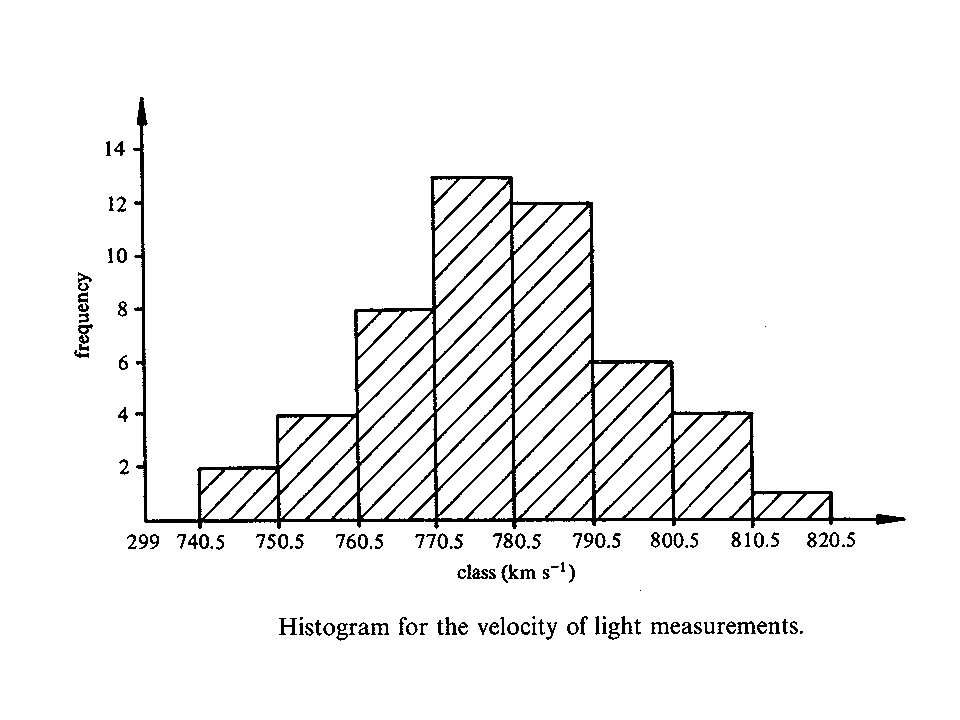
If your classes are made up of a GROUP of readings than you would consider a histogram as in this example using velocity of light measurements.


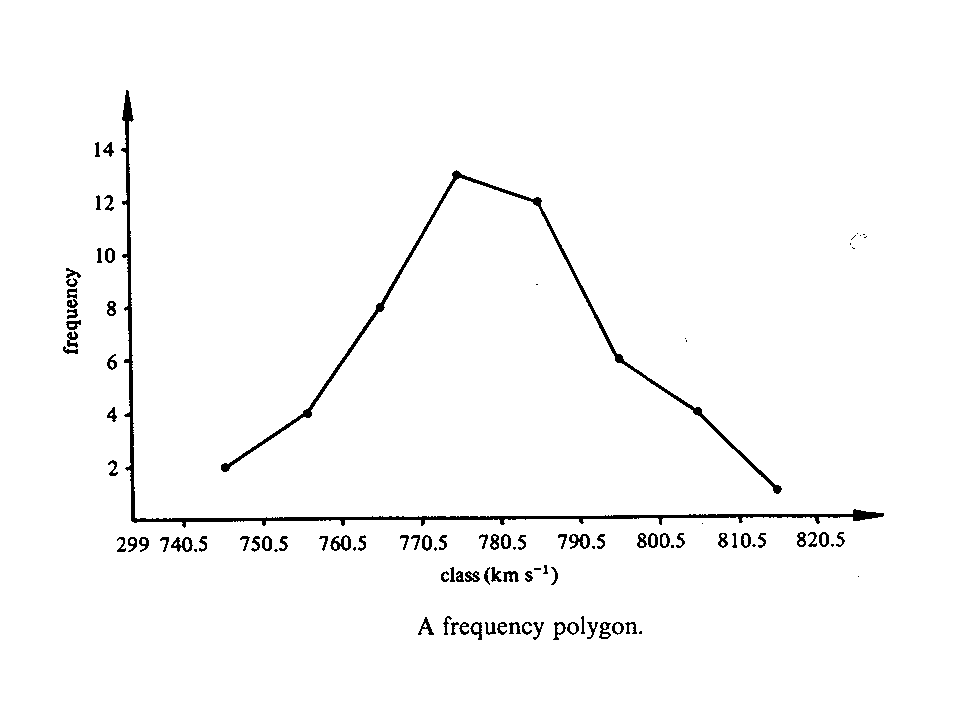
Now if you were to join the mid-point of each class by a straight line you would obtain a frequency polygon. This would allow you to easily compare several distributions on a single graph.

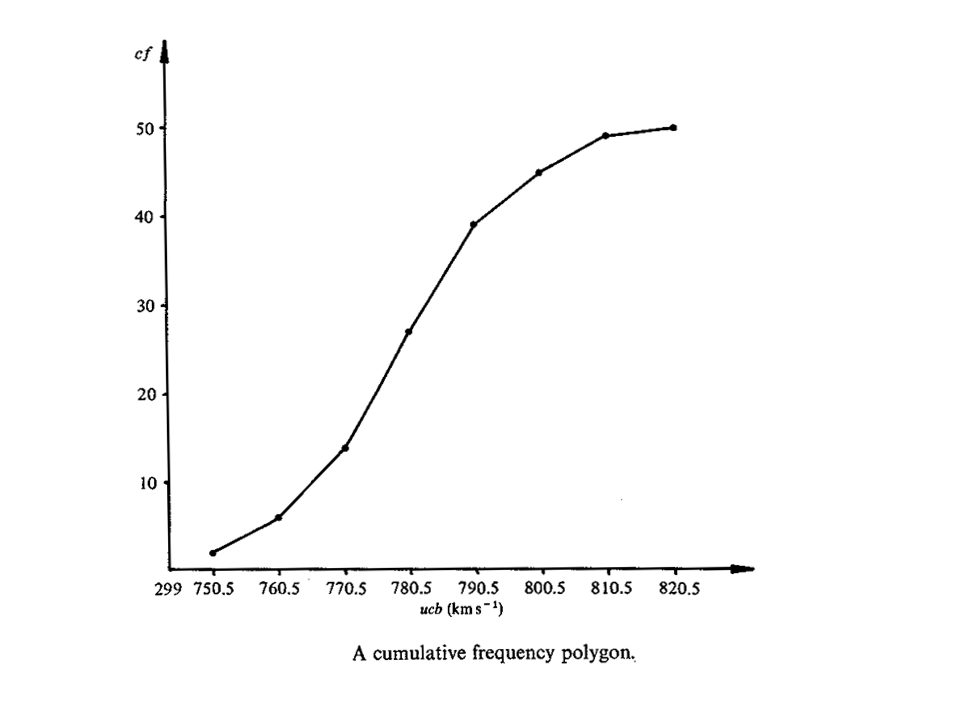
Finally, if you were to plot the CUMULATIVE frequency against the upper class boundary you would produce a cumulative frequency polygon – AKA the “ogive” as it has the characteristic arch-like shape found in architecture. 


If you ever find yourself using the term ogive in a public setting and getting blank stares from your friends then refer to the funny “jive” scene in the infamous movie Airplane! to diffuse the situation: Airplane! – Jive Scene.


Hopefully, everyone will say: “Oh, jive. I get it!”…


Let’s talk a little about data types next time. Ok?


See you in the blogosphere…


Pascal Tyrrell

Great Expectations and What the Dickens is Probability Distribution Anyway?

If you are feeling like Pip in Charles Dickens’ wonderful novel Great Expectations every time you think of statistics, you are not alone! Not sure who Pip is? Have a peek at the latest of many movies based on this book: Great Expectations trailer

Pip started life in a poor community raised by a much older cruel sister. He did, however, grow up to be a gentleman (and a scholar?) and come to realize that our great expectations in life won’t necessarily come true. We instead work hard all of our lives and ultimately have to accept what is. Getting too serious? Have a gander at Diggy Simmons music video “Great Expectations” to relax a bit: Diggy Simmons music video

Ok we’re back. So what is the link between Pip and statistics?

As a researcher we are often interested in “what to expect” in future experiments or trials. The methodology used to perform the research and analysis of results will help to obtain an estimate of the answer to your question – see my previous post if you are in the dark about this one (Allegory of the cave).

In statistics the term “expectation” is given a precise definition in terns of probabilities (the chance that something will happen – how likely is it that some event will happen). Thus, if we consider an experiment or trial as taking a variable x at random from some population of readings and recording its value then the value to expect for x is the mean µ of this population.

Here is the rub: the population mean is usually a quantity whose value we can NEVER determine exactly – it is the value to EXPECT. This is a VERY important concept in statistics.

*** Caution: stats talk below – skip if already feeling dizzy…

When we make predictions about future trials we have to keep in mind that we are working with a sample of results that will necessarily have a measure of uncertainty associated with them. By organizing our data into frequency tables we can then present its distribution graphically (ie: frequency curve, histogram) and get our first appreciation of where the center is (mean, median, mode) and scatter (variance and standard deviation). Finally, if we convert our frequency distributions to probability distributions (divide each class frequency by the sum of frequencies) we can obtain expected values from these distributions. Plural? There are different types? Yes, and we will chat about these in future posts…

*** Safe re-entry here:

I am ok with having to work with estimates and never knowing the truth. You? As Socrates once said (a long, long time ago!): “The only true wisdom is in knowing you know nothing.”

So what next? Maybe watch the movie “Great Expectations” this week-end and tell everyone that you were studying for your stats class. Let’s talk about organizing data next.

Enjoy the movie.

Pascal Tyrrell

The Truth? You Can’t Handle the Truth!

In “A Few Good Men” Jack Nicholson growls “You can’t handle the truth” to Tom Cruise in his Academy award winning performance. Watch a clip of his gritty performance: A few good men. Our pursuit of the truth leads to an interesting path indeed.

This series of posts has as objective to help you develop a scientific “sense”. Have a quick peek at my other posts (http://mivip-utoronto.blogspot.ca/) if you haven’t already and come back. So wanting to know the truth is something we all strive for on a daily basis. Finding the truth is another matter altogether and this philosophical conundrum has challenged many great minds for centuries.

The Roman Emperor Marcus Aurelius once stated many, many years ago: “Everything we hear is an opinion, not a fact. Everything we see is a perspective, not the truth”. Have a quick peek at the trailer for “Gladiator” to put you in the mood. Gladiator
Now Greek philosopher Plato, who predated Marcus a few centuries, got the ball rolling when he presented his Allegory of the Cave, in which he symbolically described his belief that the world revealed by our senses is not the real world but only a poor copy of it, and that the real world can only be apprehended intellectually. Plato used an analogy where we are represented as a gathering of people who live chained to the wall of a cave all of our lives, facing a blank wall. We watch shadows projected on the wall by things passing in front of a fire behind them, and begin to designate names to these shadows. The shadows are as close as we get to viewing reality.

 
Getting too serious? Take a break and listen to Siouxsie And The Banshees – Shadowtime Shadowtime
 
So why all the philosophy? Because the concept of getting as close to the truth as possible is important. We accept that the truth will never be known and, therefore, we must also accept as an answer an estimate (let’s say the mean of a sample) or “best guess”. As a scientist we will make sure to offer our reasoning and methodology as to how we obtained this estimate and more importantly we will offer a measure of how confident we are about this estimate – voila, biostatistics in a nutshell. Don’t believe me? Keep reading my posts and I will explain.
 
If we always knew the truth, would we need to measure anything? How boring would that be? As William Cowper aptly put it: “Variety’s the very spice of life, That gives it all its flavor”.
 
 
Here is what I suggest you do next in your endeavor to become a researcher: keep on asking crazy numbers of questions but now think of what factors will influence the estimate you will produce for your answer. Where does this “variety” that Cowper mentions come into play? 
 
Next we will talk about the concept of “expectation” and how this is important in the world of scientific research.
 
 
How is that pocket protector working for you so far? 
 
 
Pascal Tyrrell


To be, or not to be: what is in a research question?

So you now spend a minimum of an hour a week wearing your shirt with a pocket protector thinking, among other things, about what you can do to speed up your training to become a scientist. Don’t know what I am talking about? Go and see my previous post and come back.(Pocket protector)
 
Ok. You are now asking questions furiously at all times of the day (and night?) trying to get a handle on how to structure a question in order to best help with finding an answer. Why? It’s all about clarity. Not sure what that is? Listen to Zedd for some instruction: Clarity – Zedd
 
A great French author Marcel Proust – yes another French author, my first name is Pascal after all – said: “The voyage of discovery lies not in seeking new horizons, but in seeing
with new eyes.”
Maybe by asking the right questions we can inch ever so slowly towards the truth that lies right in front of our own eyes! So take a fresh look at what and how you do all things scientific.
 
Here is what I suggest for formulating your questions:
 
Use the PICO model (for a little more detail: PICO)
 
Patient, Population, Problem
Intervention
Comparison (optional. PIO when absent!)
Outcome
 
Essentially in a clinical setting – For a patient with (Problem), how does (Intervention) compare to (Comparison) with regard to (Outcome)?
  • Is MR angiography more effective than a Doppler carotid ultrasound in diagnosing and describing carotid artery disease in obese middle-aged males and females?

or PIO – For a patient with (Problem), does (Intervention) affect (Outcome)?

  • Is a MR angiography effective in diagnosing and describing carotid artery disease in obese middle-aged males and females?
PICO can be applied to most research questions that you may have – yes even outside of Medical Imaging and in the real world (see Scientific thinking in business). 
 
Just remember that you will most probably want to formulate and test a hypothesis based on your research question. For quantitative statistical analysis you will want your question to be answerable by yes/no or a number. For qualitative analysis your question will typically start with: What is/are…? 
 
Keep practicing and we will chat about testing hypotheses next post. Stay tuned…
 
 
Pascal Tyrrell


So you want to be a researcher? Get a pocket protector…

You are a student who wants to pad the resume with extracurricular activities – maybe thinking of a career in healthcare. What could you do? You’ve always heard of your “brainy” friends getting into research. But is it for you….


Faith’s post “Research Behind Research” from yesterday gives us a glimpse into how research may be less of a scary thing than most people think. Go have a quick read and come back.


Ok, why the pocket protector? Because it’s a start. “Fake it until you become it” as states Amy Cuddy from Harvard University in her awesome TED Talk (Cuddy TED talk)


So here is what I suggest to get started on your new research persona:


1- Buy, borrow, or make a pocket protector. Maybe get a shirt with a pocket too.
2- Set aside one hour a week to wear your shirt and pocket protector. 
3- Find somewhere quiet but inviting with as few distractions as possible for your new activity.
4- Listen to John James “I wanna know” to get you motivated (I Wanna Know).

Now for the interesting part – how do I do research?


Research is a structured approach to discovery. You need to organize your thoughts and your methods – always. Use your time to figure out what methods work best for you. What are your preferred search engines? Do you always use Google? Do you Bing every now and again? How do you record your ideas, findings, links, articles… etc. How often are you successful at finding the answer? Do you keep track of what you did when you were?


Though being organized will take you a long way, the most important component of research is the question that you are asking.  Not as easy as you may think. As the well respected French anthropologist Claude Levi-Strauss suggested: The scientist is not a person who gives the right answers, he’s one who asks the right questions.”


Start thinking of and asking questions – all the time. Take the time to answer some of them during your research hour. Do you find the way your question is structured helps in finding an answer? How about if your question is answerable by a yes/no? A number (average height for expl)? Any easier than if your question starts with “What are…”?


Stay tuned as we will address all of these interesting challenges in this blog… 


Pascal Tyrrell
Follow us on twitter for the latest updates of the program! @MiVIP_UofT