Be More Specific… Or It May Not Be Causal?!!!

Well, if you are relaxed and heading nowhere in particular then I guess you probably won’t be too concerned with showing causality either. In our past few posts we have been discussing Bradford Hill’s criteria for determining causality (see Strength and Consistency for a refresher). If you are stressed out already, have a listen to “Come the morning” from an up and coming Canadian artist from Winnipeg, Manitoba – Sebastian Owl – before reading on.


Today we will talk about the third of the nine Hill criteria: Specificity

 
When considering the specificity of the association of interest, we wish to establish whether a single putative cause produces a specific effect. When specificity of an association is found, it provides additional support for a causal relationship.  But keep in mind that very often the effect under investigation may have more than one cause. So the absence of specificity in no way negates a causal relationship. This criterium of Hill’s is considered to be the least important and can often be over-ruled in the case of multi-causal relationships.


Next, post we will talk about the oh-so-important criterium: temporality.


If you are nowhere in particular then you are not being specific to your whereabouts – right? Anyway, why don’t you watch this great Film festival short by Mason Cardiff, Nowhere in particular, to decompress and…


… I’ll see you in the blogosphere.


Pascal Tyrrell

Consistent Associations May Be Causal Ones…?

Do you remember the Rain Man movie with Dustin Hoffman and Tom Cruise? Great movie that introduced Savant Syndrome to theater audiences all over the world. The savant syndrome is a rare condition in which persons with autistic disorder or other mental disabilities have extraordinary skills that stand in stark contrast to their overall handicap. There is a very interesting documentary on Kim Peeks who was the inspiration for the movie here. Anyway, last post we talked about strength – one of Bradford Hill’s criteria for causation (see here for a refresher). Today we will talk about consistency, a good qualifier for the often obsessive and ritualistic behaviors of autistic savant persons.


An association between two entities is consistent when results are replicated in multiple studies in different settings using different methods. So if a relationship is causal, we can expect to find it consistently in different studies and among different populations.  This implies that many studies need to be done before meaningful statements can be made about any causal relationship.


A great example of this is the long debated causal relationship between smoking cigarettes and lung cancer. It took hundreds, if not thousands of highly technical studies and many, many publications before a definitive conclusion could be made that cigarette smoking increases the risk of cancer and in a causal manner (see here for a statement from the CDC Surgeon General).  


So be consistent in your smoking cessation and you will consistently avoid the risk of lung cancer…


Next post we will tak about Bradford’s third criterium: specificity.


Relax listening to the very eighties styled theme music to Rain Man and…


… I’ll see you in the blogosphere.


Pascal Tyrrell

Causality and Who’s Running Up That Hill?

Yes, back to the eighties. They were my high school and undergrad years – so very memorable! This song – Running Up That Hill – by Kate Bush was her first great hit from that time.


So, why was she running up that hill you ask? Well, it was because she had finally come to realize the importance of establishing the minimal conditions needed to establish a causal relationship between two entities, of course! Somewhat like the story of Archimedes who leapt from his bath yelling “Eureka” in excitement having discovered a law of physics that would later become the building block to fluid mechanics (see Archimedes principle).


In 1965 (no, I was not born yet – but just!), Austin Bradford Hill a British medical statistician proposed minimal conditions needed to establish a causal relationship between two entities. These later became know as the Hill’s Criteria. Very often people get the relationship of association confused with that of causality. See my previous post Rebel Without a Cause for some insight on when an association can be considered as cause and effect.


Today we will talk about the first of the nine Hill criteria: Strength


– The strength of an association is defined as the size of a given association as measured by appropriate statistical tests.  The stronger the association, the more likely it is that the relation between the two entities of interest is cause and effect.  For example, the more highly correlated hypertension is with smoking, the stronger is the relation between the exposure, smoking, to the outcome, hypertension. Though we cannot be sure of the direction of the relationship (this will be achieved when we discuss Temporality) – as hypertension could hypothetically lead subjects to smoke – we can certainly decide that the strength of the association observed supports our argument of causation.


Look at that, we have completed the first criterium all ready! Next we will look at Consistency.


Have a listen to “Strength Of A Women” by Shaggy to recover from today’s fun and…


… I’ll see you in the blogosphere.


Pascal Tyrrell

Basic Functions and Why You Should Know About Them

No, I did not say “bodily functions”. That is discussed in another blog. We’re talking math today. 


So, my son was doing his homework the other night and yelled out from his room:”Daaaadddyyyy!!! Do you know what a parabola is?” For those of you who do not have teenage children this is code for “can you help me with my homework”. After reliving a few high school memories that came along with the word “parabola” I wondered over to his room to see what the latest homework challenge was going to be…


When helping my kids with their homework, I often think of how important and still relevant some of the basic math is we learnt in high school. I would like to talk a little about basic functions and how they are still used well after you have handed in your last math homework assignment.


Many (most?) scientific laws are expressed as relations between two or more variables – often physical quantities. Next comes the chicken or the egg conundrum. Were the results from an experiment used to formulate “empirical laws” or did we use existing knowledge and math to come up with new theories – that we will invariably later have to test. Welcome to the world of research!


If two variables are related in such a way that one of them (the dependent or response variable) is determined when the other is known (the independent or explanatory variable), then there exists what is termed a functional relationship between the variables.


y = f(x)


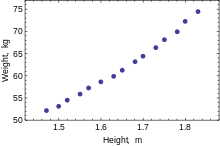
For example the relationship of height to weight in humans. In general, the taller we are the heavier we get. This results in what is called a straight-line relationship.


But not all relationships are linear. How about if we were to throw a ball up into the air and measure it’s trajectory? It would look a little like the picture on the left.


Although initially the value of the height of the ball increases with time, there comes a point when the ball stops rising and starts to fall back down to earth. The resulting curve is called – you guessed it – a parabola.


The math functions for the parabola and that of the straight line are actually related. Yes, I am serious! They both belong to the family of math functions called polynomials. In my next posts I will talk a little about how we describe these functions and how we can put them to work for us in the world of medical research.


For now, decompress watching this hilarious movie trailer Biloxi Blues which is all about basic training (you can now relate) and…


… I’ll see you in the blogosphere,


Pascal Tyrrell

Walk Like an Egyptian!

So, in my last post I talked a little about Mesopotamian medicine (see here). I am certain many of you were thinking: “What? Should he not be talking about ancient Egypt?”. Well, of course, you are right – kind of… 


Egypt rose under the pharaohs during the same period as the Mesopotamian kingdoms (from about 3000 BC). They were known for their crazy ambition and technological prowess. Their medicine was very similar to that of the Mesopotamians in that it was influenced strongly by superstition  and religious beliefs. They too had three types of healers: the swnu who practiced medicine, and, of course, the priests and the sorcerers…


One of the reasons that ancient Egyptian medicine had a greater influence on modern medicine was that they were very good at documenting and archiving their work. The Ebers papyrus (c. 1550 BC) was their principal medical document that measured over 20 meters long (it is a scroll after all) and is the oldest surviving medical book. 


The Egyptians believed we were all born healthy but were susceptible to disorders caused by demons or by intestinal putrefaction. So the importance of eating your fruits and veggies was started way long ago! They also compared our vascular network to that of the River Nile and its canals and, therefore, it was important to keep the flow free from obstructions (see here for another interesting comparison!). Though they did not appreciate vascular plaques (atheroma) at the time they had already started to  figure out the importance of a healthy vasculature. Cool! 


As with Mesopotamia, Egypt’s powerful governance created a good environment for organized medical practice. However, because both regimes were highly codified (implying many strict rules based on religion and superstition that did not allow for discussion and experimentation) it will not be until ancient Greece that the roots of modern medicine will take hold.


Dance around your living room (in private if you must) to Walk Like an Egyptian by The Bangles in order to decompress and…


… I’ll see you in the blogosphere.


Pascal Tyrrell

Who’s in Agreement?

So, let’s say you have invited everyone over for the big game on Sunday (Superbowl 49) but you don’t have a big screen TV. Whoops! That sucks. Time to go shopping. Here’s the rub: which one to get? There are so many to chose from and only a little time to make the decision. Here is what you do:


1- call your best friends to help you out
2- make a list of all neighboring electronics stores 
3- Go shopping!


OK, that sounds like a good plan but it will take an enormous amount of time to perform this task all together and more importantly your Lada only seats 4 comfortably and you are 8 buddies.


As you are a new research scientist (see here for your story) and you have already studied the challenges of assessing agreement (see here for a refresher) you know that it is best for all raters to assess the same items of interest. This is called a fully crossed design. So in this case you and all of your friends will assess all the TVs of interest. You will then make a decision based on the ratings. Often, it is of interest to know and to quantify the degree of agreement between the raters – your friends in this case. This assessment is the inter-rater reliability (IRR). 


As a quick recap, 


Observed Scores = True Score + Measurement Error


And


Reliability = Var(True Score)/ Var(True Score) + Var(Measurement Error)


Fully crossed designs allow you to assess and control for any systematic bias between raters at the cost of an increase in the number of assessments made. 


The problem today is that you want to minimize the number of assessments made in order to save time and keep your buddies happy. What to do? Well, you will simply perform a study where different items will be rated by different subsets of raters. This is a “not fully crossed” design! 


However, you must be aware that with this type of design you are at risk of underestimating the true reliability and therefore must, therefore, perform alternative statistics.


I will not go into statistical detail (today anyway!) but if you are interested have a peek here. The purpose of today’s post was simply to bring to your attention that you need to be very careful when assessing agreement between raters when NOT performing a fully crossed design. The good news is that there is a way to estimate reliability when you are not able to have all raters assess all the same subjects.


Now you can have small groups of friends who can share the task of assessing TVs. This will result in less assessments, less time to complete the study, and – most importantly – less use of your precious Lada! 


Your main concern, as you are the one to make the purchase of the TV, is still: can you trust your friends assessment score of TVs you did not see? But now you have a way to determine if you and your friends are on the same page!


Maybe this will avoid you and your friends having to Agree to Disagree as did Will Ferrell in Anchorman…


Listen to an unreleased early song by Katy Perry Agree to Disagree, enjoy the Superbowl (and Katy Perry) on Sunday and…


…I’ll see you in the blogosphere!


Pascal Tyrrell

Who is your neighbor?

Classic Seth Rogan movie. Today we will be talking about good neighbors as a followup to my first post “What cluster Are You From?“. If you want to learn a little about bad neighbors watch the trailer to the movie Neighbors.


So let’s say you are working with a large amount of data that contains many, many variables of interest. In this situation you are most likely working with a multidimensional model. Multivariate analysis will help you make sense of multidimensional space and is simply defined as a situation when your analysis incorporates more than 1 dependent variable (AKA response or outcome variable). 


*** Stats jargon warning*** 
Mulitvariate analysis can include analysis of data covariance structures to better understand or reduce data dimensions (PCA, Factor Analysis, Correspondence Analysis) or the assignment of observations to groups using a unsupervised methodology (Cluster Analysis) or a supervised methodology (K Nearest Neighbor or K-NN). We will be talking about the later today.


*** Stats-reduced safe return here***
Classification is simply the assignment of previously unseen entities (objects such as records) to a class (or category) as accurately as possible.  In our case, you are fortunate to have a training set of entities or objects that have already been labelled or classified and so this methodology is termed “supervised”. Cluster analysis is unsupervised learning and we will talk more about this in a later post.


Let’s say for example you have made a list of all of your friends and labeled each one as “Super Cool”, “Cool”, or “Not cool”. How did you decide? You probably have a bunch of attributes or factors that you considered. If you have many, many attributes this process could be daunting. This is where k nearest neighbor or K-NN comes in. It considers the most similar other items in terms of their attributes, looks at their labels, and gives the unassigned object the majority vote!


This is how it basically works:


1- Defines similarity (or closeness) and then, for a given object, measures how similar are all the labelled objects from your training set. These become the neighbors who each get a vote.


2- Decides on how many neighbors get a vote. This is the k in k-NN.


3- Tallies the votes and voila – a new label! 


All of this is fun but will be made much easier using the k-NN algorithm and your trusty computer!


So, now you have an idea about supervised learning technique that will allow you to work with a multidimensional data set. Cool.


Listen to Frank Sinatra‘s The Girl Next Door to decompress and I’ll see you in the blogosphere…


Pascal Tyrrell

What Cluster Are You From?

This week and I had the pleasure of presenting to the Division of Rheumatology Research Rounds – University of Toronto. They were a fantastic audience who asked questions and appeared to be very engaged. Shout out to the Rheumatology gang!


So, I was asked to talk about a statistical methodology called Cluster Analysis. I thought I would start a short series on the topic for you guys. Don’t worry I will keep the stats to a minimum as I always do!


Complex information can always be best recognized as patterns. The first picture below on the left certainly helps you realize that it is not a simple task to know someone at a glance.


Now, I guess it doesn’t help that many of you have never met me either! However, you can appreciate that things get a little easier when the same portrait is presented in the usual manner – upright! 


This is an interesting example where the information is identical, however, our ability to intuitively recognize a pattern (me!) appears to be restricted to situations that we are familiar with.


This intuition often fails miserably when abstract magnitudes (numbers!) are involved. I am certain most of us can relate to that. 


The good news is that with the advent of crazy powerful personal computers we can benefit from complex and resource intensive mathematical procedures to help us make sense of large scary looking data sets.


So, when would you use this kind of methodology you ask? I’ll tell you…


1 – Detection of subgroups/ clusters of entities (ie: items, subjects, users…) within your data set.


2 – Discovery of useful, possibly unexpected, patterns in data.


OK, time for some homework. Try to think of times when you could apply this kind of analysis. 


I’ll start you off with an example that you can relate to. Every time you go to YouTube and search for your favorite movie trailer you get a long list of other items on the right that YouTube thinks may be of interest to you. How do you think they do that? By taking into account things like keywords, popularity, and user browser history (and many, many more variables) and using cluster analysis of course! You and your interests belong to a cluster. Cool!


In this series, we will delve into this fun world of working with patterns in data. 


Now that you have peace of mind, listen to The Grapes of Wrath


See you in the blogosphere,


Pascal Tyrrell


Starting a new research project? Think Zorro!

Well, OK maybe think Zotero. The Mask of Zorro was such a great movie I could not resist. Having said that, when starting a new research project it may be helpful for you to think of yourself as Zorro. It may give you that extra zip required to get you through the inevitable research project doldrums…


So what is this Zotero thing anyway? Well Zotero is an open source reference management software that can act as your personal research assistant – helping you to organize and cite the numerous articles that you will be reviewing.


I was talking to Ori the other day – who is in the Radiation Therapy program at the Michener Institute – and he is in the process of planning a research project. As it turns out he has been a member of the MiVIP family since the beginning so he is well aware of my earlier posts that will help him along:


1- Thoughts on how to become a researcher


2- What is in a research question?


3- What makes up a good research question with the F.I.N.E.R. series.


Now how about the reference management software thing? Well, I give you an easy, fun, and instructional e-learning module to help you along. Our group has just finished our first kick at the can (so to speak) and so I invite you to have a look. Here is the link:


MiEducation Zotero e-learning module


Tell us what you think by posting comments and suggestions to this post.


Maybe listen to Ylvis in What Does the Zorro Say? while you go through the module. Fox in spanish is zorro…

 
… and I’ll see you in the blogosphere.
 
 
Pascal Tyrrell


Face Validity: Who’s Face Is It Anyway?

Yes, I was a big fan of the A-Team. Who wasn’t? Mr. T (I guess that makes me Prof. T…) was always entertaining to watch. Lieutenant Templeton Arthur Peck was suave, smooth-talking, and hugely successful with women. Peck served as the team’s con man and scrounger, able to get his hands on just about anything they needed. Need a refresher? Have a peek here.


Well in a past post 2 Legit 2 Quit we talked about why we assess validity – because we want to know the nature of what is being measured and the relationship of that measure to its scientific aim or purpose. So what if we are uncertain that our measure (a scale for example) looks reasonable? We would consider face validity and content validity. Essentially, face validity assess whether or not the instrument we are using to measure appears to be assessing the desired qualities or attributes based on “the face of it”. Content validity – that was touched on in the previous post – is closely related and considers whether the instrument samples all of the relevant or important content or interest.


So, why the importance of face validity? Whenever you need to interact successfully with study participants there is often a need to:


– increase motivation and cooperation from participants for better responses.
– attract as many potential candidates.
– reduce dissatisfaction among users.
– make your results more generalizable and appealing to stake holders.


These are especially important points to consider when planning a study that involves human subjects as respondents or there exists any level of subjectivity in how data is collected for the variables of interest in your study. 


However, you want to avoid a “Con Man” situation in your study where respondents’ answers are not what they appear to be. As a researcher you need to be aware that there may be situations where Face Validity may not be achievable. Let’s say for instance you are interested in discovering all factors related to bullying in high school. If you were to ask the question ‘ have you ever bullied a classmate into given you his/her lunch money?’ you may have Face Validity but you may not get an honest response! In this case, you may consider a question that does not have face validity but will elicit the wanted answer. Ultimately, the decision on whether or not to have face validity – where the meaning and relevance are self-evident – depends on the nature and purpose of the instrument. Prepare to be flexible in your methodology!


Remember that face validity pertains to how your study participants perceive your test. They should be the yard stick by which you assess whether you have face validity or not.


Listen to Ed Sheeran – The A Team to decompress and…


… I’ll see you in the blogosphere.


Pascal Tyrrell