In cognitive psychology, attention refers to the process of concentrating mental effort on sensory or mental events. When we attenuate to a certain object over others, our memory associated with that object is often better. Attention, according to William James, also involves “withdrawing from some things in order to effectively deal with others.” There are lots of things that are potential objects of our attention, but we attend to some things and ignore others. This ability helps our brain save processing resources by suppressing irrelevant features.
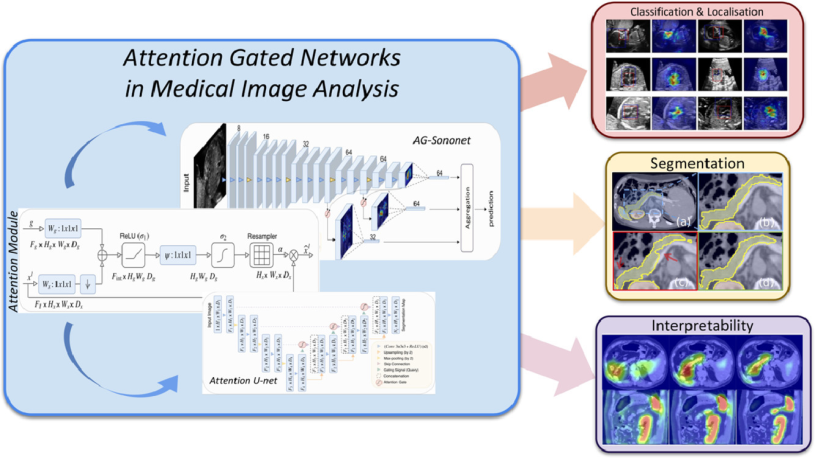
In image segmentation, attention is the process of highlighting the relevant activations during training. Attention gates can learn to focus on target features automatically through training. Then during testing, they can highlight salient information useful for a specific task. Therefore, just like when we allocate attention to specific tasks our performance would be improved, the attention gates would also improve model sensitivity and accuracy. In addition, models trained with attention gates also learn to suppress irrelevant regions as humans do; hence, reducing the computational resources used on irrelevant activations.
Now let’s use attention in a sentence by the end of the day!
Serious: With the introduction of attention gates in standard U-Net, the global information of the recess distention is obtained, and the irrelevant background noise is suppressed which in turn increases the model’s sensitivity and leads to smoother and more complete segmentation.
Less serious:
Will: That lady said I am a guy worth paying attention to (。≖ˇ∀ˇ≖。)
Nana: Sadly, she said that to the security guard…