A YSP Student Perspective: MRI and Carotid Artery Disease

Hershel Stark, MED YSP 2014 Student

Throughout the month of July, I participated in a research program with the Division of Teaching Laboratories within the Faculty of Medicine at the University of Toronto. I was assigned to work with Prof. Pascal
Tyrrell and the Department of Medical Imaging, and spent the majority of my time with the Vascular Biology Imaging Research Group (VBIRG) at Sunnybrook Research Institute. I would like to discuss my experiences, what I gained from the program, and how I can take those skills with me into the future.


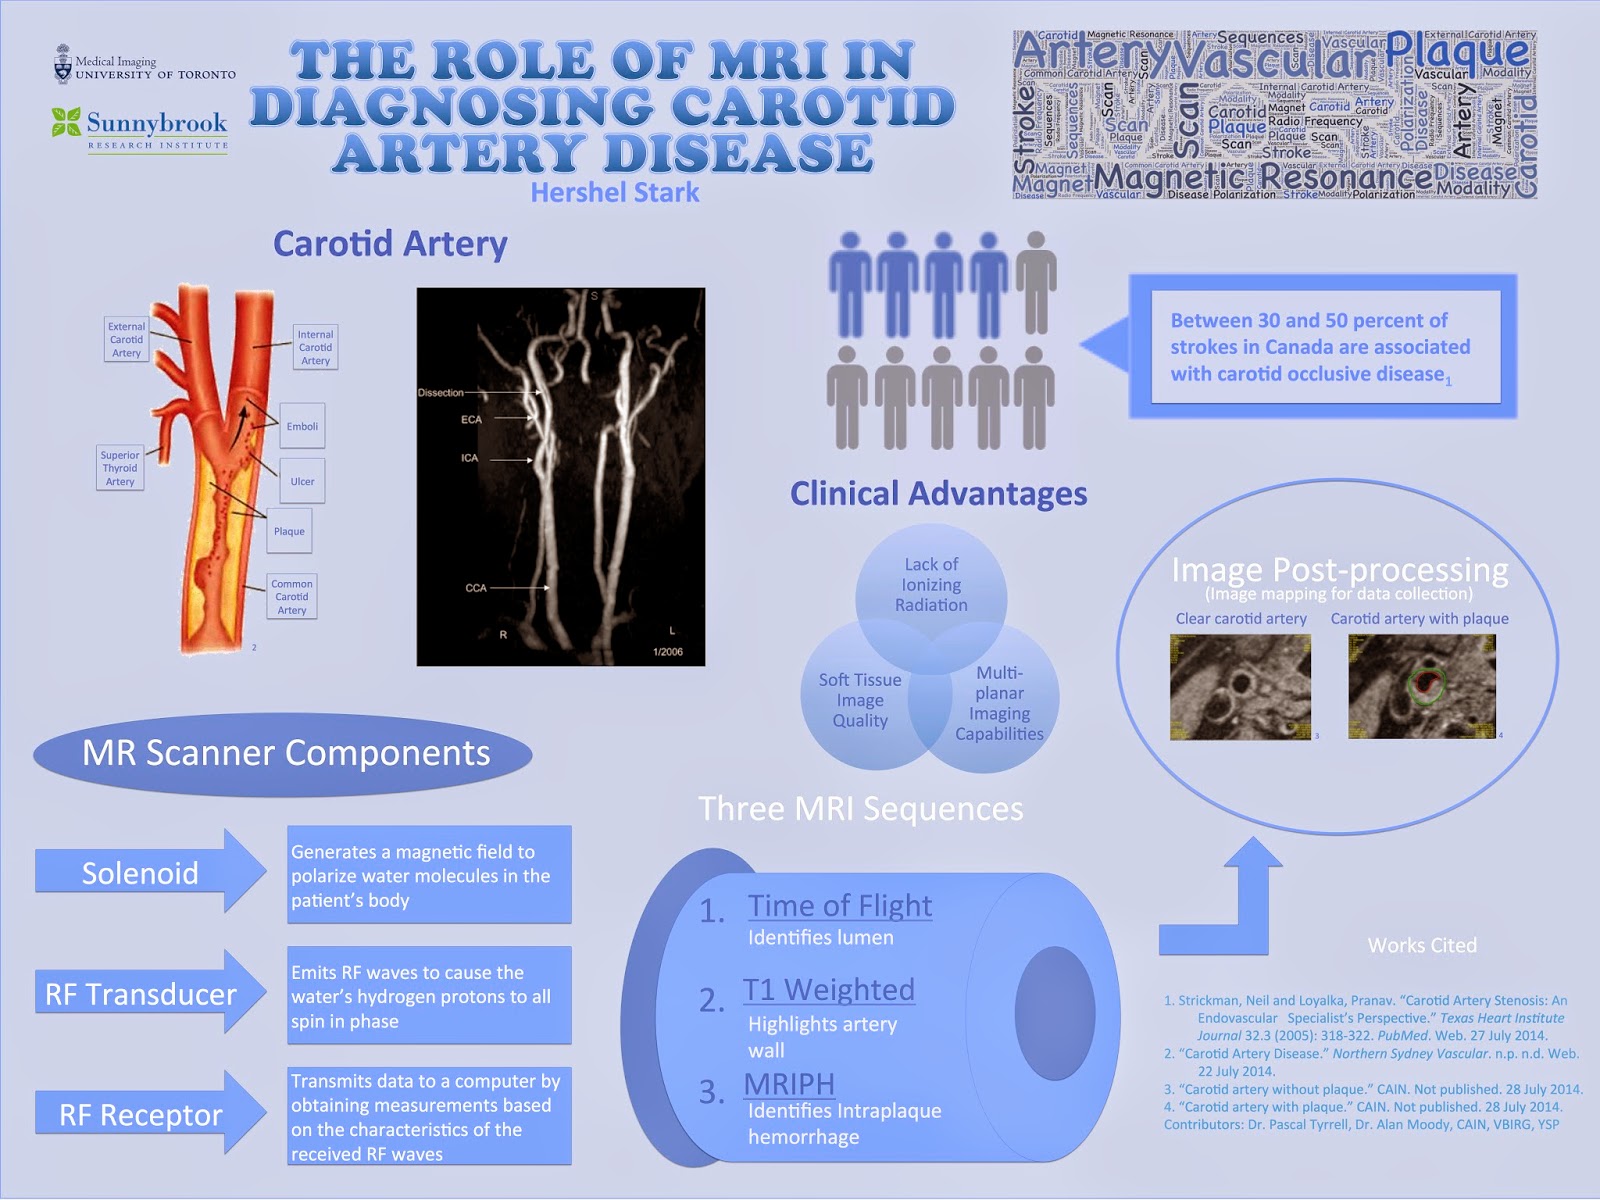
Essentially, the program was composed of presentations and shadowing opportunities in which I was introduced to various imaging modalities used in both the clinical and research fields. I primarily studied MR imaging, but was nevertheless exposed to other modalities including ultrasound and CT.  Towards the end of the program, I had two principal objectives: to present my experiences to the VBIRG group and to design an infographic for displaying. Below is a copy of my infographic:

Notwithstanding the abundance of knowledge I gained from studying the subject content, I acquired a variety of essential research skills by partaking in the program. Shadowing proficient researchers as they collected
and analyzed data provided me with a thorough insight of a researcher’s methods and techniques. The researchers that I worked with appropriately explained their individual roles on the research team, which led to my understanding of the significance of collaboration in scientific and medical research.
One last aspect of the program that I would like to address is the daily workshops that were conducted by two instructors from the Division of Teaching Laboratories, Jastaran Singh and Jabir Mohamed. Each of these brief workshops focused on an important general topic relevant to research in general, ranging from discussing common scientific practices to elaborating on literary research. I believe that the combination of skills and knowledge that I obtained from all elements of the program will be useful in my potential
research career in university.
 Lastly, I would like to take this opportunity to formally thank all of those that contributed to making the program a truly enjoyable and intellectually stimulating experience. I would like to extend my gratitude to
Dr. Alan Moody and the members of the VBIRG group for allowing me to shadow their research projects, as well as to Prof. Pascal Tyrrell and the Department of Medical Imaging at U of T for constructing the program and offering much assistance in the formation of my infographic. Finally, I’d like to thank Dr. Chris Perumalla and the Division of Teaching Laboratories in the Faculty of Medicine at U of T for formulating the research module of the Youth Summer Program, and Jastaran Singh and Jabir Mohamed for providing guidance as instructors throughout the program.
Best of luck in all of your future endeavours,
Hershel Stark

Breaking Up Is Hard to Do

Last week I met with Helen, a clinical investigator program radiology resident from our department, about her research (shout out to Dr Laurent Milot’s research group). When discussing predictors and outcomes for her retrospective study it was suggested that some continuous variables be broken up into levels or categories based on given cut-points. This practice is often encountered in the world of medical research. The main reason? People in the medical community find it easier to understand results that are expressed as proportions, odds ratio, or relative risk. When working with continuous variables we end up talking about parameter estimates / beta weights and such – not as “reader friendly”. 


Unfortunately, as Neil Sedaka sang about in his famous song Breaking Up Is Hard to Do, by breaking up continuous variables you pay a stiff penalty when it comes to your ability to describe the relationship that you are interested in and the sample size requirements (see loss of power) of your study.


You are now a newly minted research scientist (need a refresher? See Pocket Protector) and are interested in discovering relationships among variables or between predictors and outcomes. The more accurate your findings the better the description of the relationships and the better the interpretation/ conclusions you can make.The bottom line is that dichotomizing/ categorizing a continuous measure will result in loss of information. Essentially, the “signal” which is the information captured by your measure will be reduced by categorization and, therefore, when you perform a statistical test that compares this signal to the “noise” or error of the model (observed differences between your patients for example) you will find yourself at a disadvantage (loss of power)David Streiner (great author and great guy!) gives a more complete explanation in one of his papers.


Now, as we see in the funny movie with Vince Vaugh and Jennifer Aniston, The Break Up, there are times when categorization may make sense. For example when the variable you are considering is not normally distributed (see Are You My Type?) or when the relationship that you are studying is not linear. We will talk about these situations in a later post.


Don’t forget: you will get further ahead if you keep your variables as continuous data whenever possible.


See you in the blogosphere,


Pascal Tyrrell

MiWord of the Day Is… X-Ray!

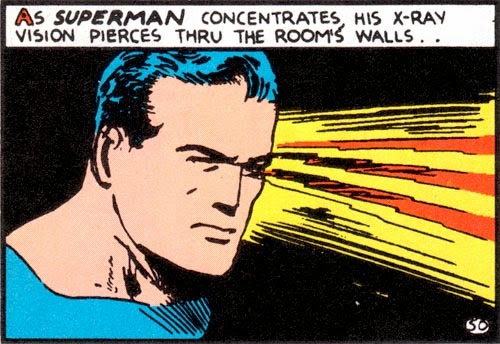
Yup! Want some of that. Not only is Superman cool but he has x-ray vision. Unbelievable. Or is it? Radiologists have the same x-ray vision but without the Spandex suit – or at least they don’t wear it to work that I am aware of.


The word of the day is x-ray. You have already successfully used “Roentgen” in casual conversation last week (don’t know what I am talking about? See Mi Word of the Day Is… Roentgen!) and today I will talk a little about what Roentgen was first in measuring and describing – x-rays.


Let’s say you are in your lab and you are working with passing electrical discharges through vacuum tubes – a typical Saturday afternoon activity with friends. As chance would have it your little sister’s barium salts paintings happen to be drying near-by and you notice a faint glow emanating from them every time you run your experiments. No matter how much you try to block any light coming from your vacuum tubes the glow persists. What? That’s odd. How’s that happening? Well my friend, you have just crossed over into the Twilight Zone (awesome old tv series) and discovered a form of electromagnetic radiation.


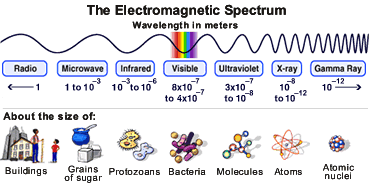
Visible light is but a very small part of the electromagnetic spectrum. Moving from visible light to longer wavelengths and lower frequencies we find infrared (keeps food warm at restaurants), microwaves (to warm your pizza pop) and radio (not the one streamed through the internet!). 


Now if you move in the opposite direction from visible light you find shorter wavelengths with higher frequencies starting with ultraviolet (what helps you get that summer tan), x-rays (word of the day), and finally gamma rays (topic for another day!). So x-rays are about the size of atoms and radio waves the size of buildings. Crazy. I think what is surprising is that with the naked eye we “see” so little and yet so much (philosophy anyone?).


So, x-rays are short wavelength, high frequency, high energy electromagnetic radiation that is able to penetrate some substances more easily than others. For example, they penetrate flesh more easily than bone, and bone more easily than lead. Thus they make it possible to see bones within flesh and a bullet embedded in bone. The ability of X rays to penetrate depends on their wavelength and on the density and thickness of the substance being scanned.


Now if you remember the rules:


1- I introduce and discuss a word.
2- You have to use the word in a sentence by the end of the day. No need to use it in the correct context – actually out of context is more fun and elicits a more entertaining response!
 
 
Today, we have to use “x-ray” in a sentence. Here are two examples to help you along:

Serious: Hey Frank, did you know the radiation you received during your chest x-ray last week was actually “soft” x-rays? Ones with shorter wavelengths and more penetrating power are used for scanning archaeological artifacts.


Less serious: Frank! Dude, I got them! My x-ray specs just came in the mail. Let’s go the beach…

See you in the blogosphere,


Pascal Tyrrell

Agreement Is Difficult: So What Are We Gonna Do? I Dunno, What You Wanna Do?

It is never easy to come to an agreement – even amongst friends! The Vultures from Disney’s The Jungle Book (oldie but a goodie) certainly know this. In medical research measuring agreement is also a challenge. In this series of posts I am going to talk about agreement and how it is measured.


Agreement measures the “closeness” between things. It is a broad term that contains both “accuracy” and “precision”. So, let’s say you are shopping for screen protectors for your wonderful new phone. You head to the internet and start going through the gazillion links advertising screen protectors of all sizes and styles. As you just spent your savings on the phone, you do not have much money left over for the screen protector. You decide on a generic brand and order a pack of 10. After an unbearable wait of a week to receive them in the mail you open the pack and find that even though you ordered the screen protector to fit your specific phone they are a little small… except for two that fit perfectly! What? That’s annoying.


So, how close are the screen protectors to being “true” to the expected product? This is agreement. Now, most of them are a little small. This represents poor “accuracy”. This is because there exists a systematic bias. If you took the mean size of these 10 protectors you would find that it deviated from the true expected value – size in this case. Furthermore, you found that two of the 10 protectors actually fit your phone screen rather well. This is great, but this inconsistency between your protectors represents poor “precision”. This time we are interested in the degree of scatter between your measurements – a measure of within sample variation due to random error (see my Dickens post for more info).


Now the concepts of accuracy and precision originated in the physical sciences where direct measurements are possible. Not to be outdone, the social sciences (and then soon to adopt medical sciences!) decided to establish similar concepts – validity and reliability. We will discuss these in a latter post but for now simply remember that the main differences are that a reference is required for validity and that both validity and reliability are most often assessed with scaled indices.


Phew! That was a little confusing. Have a listen to We Just Disagree from Dave Mason to relax.


Next post we will look a little more closely at two special kinds of precision – repeatability and reproducibility.


See you in the blogoshere,


Pascal Tyrrell

The Key to Research: (Key)Words

Do you ever hear a good song on the radio, catch some of the lyrics, and try to type in those lyrics into Google or Youtube to find that particular song you rocked out to on the way home? When that happens and you Google it, do you ever count  how many options you need to pass until you hit the right song? 


Yes, you are not the only one, many people use Google to further explore some of the things they have come across throughout daily encounters. For each instance google is used, whether it be for a song or for neuroscience research and analysis, one thing remains in common: keywords. 


Keywords are essential when searching for various types of information, and the options appearing on any search engine are dependent on the keywords given. How does one establish appropriate keywords for a search engine entry? 
For instance, if one wants to find out more about medical imaging, perhaps using those exact words would give one a head start in finding information. If one wants to find out about the modalities of medical imaging, typing in ‘modalities of medical imaging’ may also be helpful as well. The tricky part becomes when searching for specific uses and studies of the use of those modalities, in medical papers. In any medical search engine, like PubMed, keywords can make or break a search, and are very specific, as the many sections of medical imaging involve many specific factors and details that differ from each study. So next time you decide to search something, whether it be as general as ‘medical imaging’ or specific as ‘cost effective analysis of CT scans,’ just remember that those keywords may give you what you need, or lead you to a place you don’t want. 
Keep (re)Searching!


Faith Balshin 
Follow us on Twitter! @MiVIP_UofT  

Researcher’s Dream: Katy Perry Edition

What happens when you put a famous pop superstar with various Billboard number one hit singles as an endorser for a medical field involving teeth, mouth and gum surgeries? 
A Katy Perry-odontist!
And no, I am not insinuating the likelihood of Ms. Perry giving up her “Hard Candy” tour and making her way down to Harvard Med for a doctor of dental surgery specializing in periodontistry, but in reality, when researching, there are a lot of weird combinations of research that actually lead to a plausible conclusion!
Take cost effectiveness of MRIs, CT scans and ultrasounds. There are many variables pertaining to which machine is more cost effective, but in order to find that out, the research being done with regards to the cost involves stepping OUTSIDE THE BOX and figuring out unique key factors that all contribute to the cost, timing, and effectiveness. One must observe not only the actual cost of the machine, but also the condition the patient is in and the situation of the effected area. In order to look at that, maybe some family history must be dug up. And there you go! A whole research perspective on family history of certain patients, just to figure out cost effectiveness of a certain machine. Weird combination of research if you think about it, but in the end, very effective in reaching somewhat of a conclusion to the research question, just like the medical imaging equipment should be doing in the first place! Do not underestimate the lengths in research it takes to solve the question at hand, and always think outside the box, because you never know what you will find, and someday, maybe Katy Perry will open up her own clinic, and sooth patients with her very own soundtrack!
Keep Researching and Singing, 
Faith Balshin 
Don’t forget to check out MiVIP’s twitter account, @MiVIP_UofT! 
Comment on what you think are weird research combinations if you dare! 

It’s Cold Out Today – Please Remember to Dress Your Naked P-Value…

Ok, so you agree to dress your little friend before sending him/her out into the cold world of publication. But what is a p-value anyway? I realize that I am jumping the gun (pun intended) a little as it forces us to talk about inferential statistics – a challenging topic. So today I will only give you a small taste of what is to come. First, to get you in a good mood I want you to watch the trailer for the first of three hilarious Naked Gun movies.


We have already talked about research questions and today I would like to introduce you to their children the research hypotheses. Essentially they are a version of their parents that summarize the main elements of a study – sample, predictor and outcome variables – in such a way that you are able to perform a test of statistical significance. These hypotheses are not required for descriptive studies like the ones we have been discussing in our blog so far. For instance if we were to ask how many people who read this blog enjoyed the Naked Gun series of movies we would end up with a proportion. We could then simply describe our findings as discussed in my Ogive post. 


But what if you wanted to now if the proportion of gals differed from the proportion of guys who enjoyed the movies as you suspect that the type of humor will please guys more than gals? As we are research scientists we would want to test this “hypothesis” in order to compare the findings among the groups: this is a test of statistical significance. The brilliant statistician Ronald Fisher championed this approach. Only a single hypothesis is required: the null hypothesis. It simply states that no association of interest exists. So in this case whether you are a gal or a guy is not associated with whether you like the Naked Gun movies or not in the population of blog readers.


Break! Listen to the music of P-value Diddy (he has so many names already I thought it ok to add one more) with Jimmy page from the Godzilla soundtrack.


Welcome back. So the null hypothesis is always assumed to be true until shown to be false with a statistical test. When you analyze your data and perform the test you will determine the probability of seeing an effect as big or bigger than that in your study by chance alone if the null hypothesis were true. You would reject the null hypothesis  if the p-value is less than a predetermined level of significance – typically 5% or 1 in 20.


So what is a naked p-value? It is simply a p-value obtained from the statistical test you performed on the data from your study reported WITHOUT an effect size, its sign and precision. The effect size is simply an estimate of the size of the association that you are studying – 25% more guys liked the movies as compared to the gals. The sign and precision is simply the direction of the observed difference (are you comparing gals to guys or the other way around) and an estimate of how confident you are – generally reported as a confidence interval which we will talk about in a later post.


So what is the bottom line? In order to keep your p-value warm you need to report it with the measure of the size of the association (effect size) and how confident you are about your answer.


In a subsequent post we will talk about another similar approach, Pearson-Neyman hypothesis testing, which involves two competing hypotheses (the null and the alternate hypotheses). This approach is duductive as opposed to Fisher’s inductive statistical testing approach. Both approaches are valid. It is simply a matter of determining which is more appropriate in a given situation.


See you in the blogosphere,


Pascal Tyrrell


Are You My Type, Data?

So you have come up with a research question and now you must chose a method by which your responses will be obtained. For example, a question like ‘Are you a Trekky?’ leads to a simple yes/no answer. So, are you? No need to fess up. I understand. Don’t know what I am talking about? See the trailer for my favorite of the Star Trek movies: The Wrath of Khan Trailer


What if you were to ask, ‘How much of a Trekky are you?’. You are no longer able to use a simple two-category response but one that uses a continuous scale.


An important distinction to remember when dealing with responses in research is that in general some will be categorical, such as favorite TV series, race, or marital status, and others continuous variables like blood pressure, cholesterol levels, or how much you enjoy Star Trek shows on a scale of 1 to 10 recorded on a 100 mm line. For those of you who would score high here listen to Santana – You are my kind as a reward.


This brings us to the important concept of the level of measurement. If you are working with named categories – race for example – then you have a nominal variable. Categories that have an order to them – education level for example – are ordinal variables. What if the interval between your responses is fixed and known? Then you have an interval variable – temperature in Celcius or Fahrenheit is a good example. However, is zero degrees Celcius the same as zero degrees Fahrenheit? No. The latter is much colder! Now what if you are working in Kelvin which has a meaningful zero point? Then it is a ratio variable.


Ok, so why the big deal? The important difference is between nominal/ ordinal data and interval/ ratio data. The latter two can be used in what is termed: “parametric statistics” that gives us measures of center (mean) and spread (standard deviation). We have already touched on this in previous posts. See here: Great Expectations. It makes no sense to talk about the average sex of a sample students in your study. These data must be considered as frequencies in separate categories. We previously talked about this a little here: Ogive and this type of data leads to “non-parametric” analysis. 

Enough already! I’ll let you get back to streaming Star Trek re-runs…


Next time lets talk a little about parametric statistics and how thy came to be. I’ll leave you with this quote as a teaser from one of the greatest statisticians to ever walk the earth – Ronald Fisher: “The analysis of variance is not a mathematical theorem, but rather a convenient method of arranging the arithmetic.”

Pascal Tyrrell


Pick me! Pick me! Pick me!

So now that you are a debutante research scientist you are eager to take your newly acquired skills for a test drive. But where? You could get a job as a research assistant, but jobs are scarce. Apply for a student research summer scholarship. Maybe, but how about that summer job as a lifeguard at Camp North Star (from the crazy movie Meatballs) that you have committed to? 

How about volunteering? But why would you do that? Let me tell you why. First listen to CeeLo Green to get pumped (yes, it is about firefighters but just pretend he is signing about volunteer scientists…).

There are many, many, many reasons to be a volunteer for any organization in your community. I am certain you can think of a bunch within a short brain storming session. What I want to share with you is some of my reasons. I have volunteered with special needs in my community for most of my adult life (quick calculation puts me at about 5,000 hrs to date). People’s first reaction is that of surprise. What? How do you have the time? Then they think how admirable… Sure, I’ll take that. But really, I do it because it gives me opportunity. Opportunity to learn and grow. Not only am I happy to do it and it makes others happy doing it, but I accomplish something that I may not have had the opportunity to do otherwise. Think about that. Make others happy AND gain some experience in the process.

Just like in the fantastic movie Shrek Donkey volunteers his services. He is always enthusiastic and willing to help. Listen to him ask to be picked here: Pick me! What does it get him in the end? A couple of great friends and a dragon wife. Perfect.

Create opportunities for yourself by volunteering. You will be glad you did.


Happy Valentine’s Day,

Pascal Tyrrell

Interview with the (research) Devil

Interviews, the most loved and hated type of activity for all, from the powerful, skeptical, God-like interviewers seeking information to the innocent, intimidated and incapsulated interviewees, seeking a break. So many emotions happen when two people meet for the first time, in the interview setting. I definitely know what it’s like to be put in the hot seat, as the one word I felt coming into my own interview with the University of Toronto for this program – terrifying. I was completely terrified. New offices in the heart of Toronto, I felt like a small town girl moving to the big city alone. It was almost a coming of age experience – one small step into the building, yet one giant step for the adolescent-adulthood phase I am now transitioning into. 


         As I went up the elevator and pressed the fourth floor button, I almost could not contain myself. But the scariest part of the whole ordeal was probably the moment before I found the right office. Of course, I stumble into the wrong office, and when asking the woman working there for Dr. Tyrrell, the interviewer, when I saw the look on the woman’s face that I was in the wrong place, my heart dropped. Of course, when finally meeting with Dr. Tyrrell and discussing the program, all of this fear and anxiety disappeared at the drop of a hat, but the point is, interviews are a type of research, so research can be quite adventurous! 

Stay Adventurous and Keep Reading!  

Faith Balshin