A Crash Course in Medical Imaging

Oddly enough, there’s been a surprising lack of content about medical imaging on a blog with medical imaging in its title. So in order to fill that void, I’ll be providing a brief history on the development of the clinical technique used to visualize the human body.

The advent of medical imaging dates all the way back to 1895, following the discovery of X-rays by the German physicist, Wilhelm Conrad Roentgen. The first X-ray picture was then produced, detailing the skeletal composition of his wife’s left hand. However, the actual quality of this imaging process was still very primitive, only allowing for the visualization of bones or foreign objects.

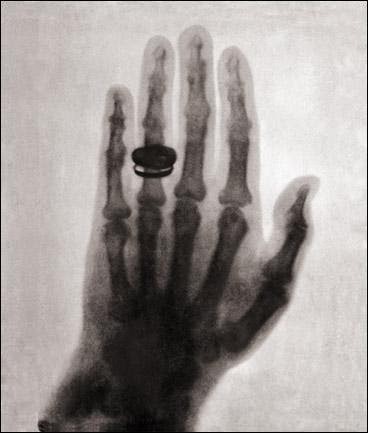
    Much to Dr. Roentgen’s pleasure, Mrs. Roentgen
    had not discarded her wedding ring
    It was not until the 1920’s that radiologists would develop a more effective method of visualization. This process, known as fluoroscopy, involved either an oral or vascular injection of a radio-opaque contrast agent, which would travel through the patient’s gastrointestinal track. Radiologists could then take films tracking the agent, allowing them to view blood vessels and digestive tracks alike.

      By the 1950’s, imaging procedures progressed towards nuclear medicine, involving radioactive compounds. These compounds were administered to patients because they could be absorbed by cellular clusters being invaded by tumours. As compounds decayed and emitted gamma rays, the recorded radiation could then be detected by gamma cameras, signalling the location of any cancerous developments. 
          The 1970’s were a period of rapid advancement for the field, as a number of modern imaging techniques were developed for clinical practice such as: 

            • Ultrasound – Uses sound waves that are able to penetrate cellular tissue. Once they reflect off the body’s internal organs, the vibrations generate an electrical pulse which can then be reconstructed into an image. 
            • PET-CT Scan – Positron emission tomography (PET) uses compounds that emit positrons when they decay rather than gamma rays. It is now combined with a computed tomography (CT) device to generate a high-resolution image displaying sectioned layers of the scanned area. 
            • MRI – A Magnetic Resonance Imaging scanner runs a strong magnetic field through the body, aligning hydrogen protons. As the protons return to their original position in the atom, they generate radio waves, which are then picked up by the scanner and used to create an image based on signal strength. 

            Fast-forward to present day and over 70 million CT scans, 30 million MRI scans and 2 billion X-rays have been performed worldwide! The field of medical imaging is still growing by the day, with ongoing research leading to new developments.

              Thanks for reading,

                Brandon Teteruck 

                Researcher’s Dream: Katy Perry Edition

                What happens when you put a famous pop superstar with various Billboard number one hit singles as an endorser for a medical field involving teeth, mouth and gum surgeries? 
                A Katy Perry-odontist!
                And no, I am not insinuating the likelihood of Ms. Perry giving up her “Hard Candy” tour and making her way down to Harvard Med for a doctor of dental surgery specializing in periodontistry, but in reality, when researching, there are a lot of weird combinations of research that actually lead to a plausible conclusion!
                Take cost effectiveness of MRIs, CT scans and ultrasounds. There are many variables pertaining to which machine is more cost effective, but in order to find that out, the research being done with regards to the cost involves stepping OUTSIDE THE BOX and figuring out unique key factors that all contribute to the cost, timing, and effectiveness. One must observe not only the actual cost of the machine, but also the condition the patient is in and the situation of the effected area. In order to look at that, maybe some family history must be dug up. And there you go! A whole research perspective on family history of certain patients, just to figure out cost effectiveness of a certain machine. Weird combination of research if you think about it, but in the end, very effective in reaching somewhat of a conclusion to the research question, just like the medical imaging equipment should be doing in the first place! Do not underestimate the lengths in research it takes to solve the question at hand, and always think outside the box, because you never know what you will find, and someday, maybe Katy Perry will open up her own clinic, and sooth patients with her very own soundtrack!
                Keep Researching and Singing, 
                Faith Balshin 
                Don’t forget to check out MiVIP’s twitter account, @MiVIP_UofT! 
                Comment on what you think are weird research combinations if you dare! 

                Baby Steps and What About Bob?

                I had the pleasure of addressing the students from the SciTech program at Tomken Middle School last week. Bright, enthusiastic, and interested in science… all 165 of them! I was there to talk about our sister program – Medical imaging Buddies. Remember the MiB movies? Very funny. Have a quick peek for fun. I’ll wait here.


                So the question is always: “what do I do to get started?”. Believe it or not this applies to whether you are a 10 year old SciTech student or a radiologist on faculty with our department. I have been doing this for a while and I would like to share some encouraging suggestions that you may find helpful:

                • Read this blog! OK, so I am shamelessly promoting my own program. But it is a perfect place to start. Easy reading, no commitment, anonymous, informative, and best of all FREE! Look for more resources like this one.
                • As you are thinking about what has been said in the various posts think of what a next step could be that would move you closer to your goal of becoming a research scientist and at the same time not trigger a fight or flight response. Take Baby Steps just like in the movie What About Bob? What a hilarious movie but the small steps to slowly move you forward is no joke.
                • Start telling people about who you are becoming. Share with them some of your achievable and positive goals. This way they will be able to encourage you when you need a little push AND be proud of you when you succeed.
                • Don’t be afraid of failure. It is simply an unwanted outcome. So what. Learn from it and move on.
                • Finally, don’t be a silo (unless you are Bruce Cockburn and singing If I had a Rocket Launcher). Be a team player. Remember to always bring something of value to your team. At first, this may just simply be positive energy and enthusiasm – good enough for my team!
                 
                Questions? Post a comment or email me!
                 
                 
                See you in the blogosphere,
                 
                 
                Pascal Tyrrell

                Rebel Without a Cause… Or Maybe?

                OK, enough with stats. Let’s talk a little about causality. You have been patiently wearing your pocket protector for a couple of months, asking the right questions all the time, and diligently reading this blog to glean as much information as possible to become a research scientist. 


                So what now? Do you feel a little like a Rebel Without a Cause? You are asking questions that are interested in describing an association of interest. How about the association between watching horror movies and myocardial infarction (MI). One possibility is that watching horror movies is the cause-effect of an MI. You’re thinking: sure but there must be other explanations. You are right! Actually there can be another 4 rival explanations:


                1- By chance alone you observed an association in your data. This is a spurious association.

                2- Due to bias (systematic error) you observed an association in your data. This is another spurious association.

                3- Effect – cause: having an MI is the reason (cause) for watching horror movies – reverse to what you were thinking.


                4- Confounding: watching horror movies is associated with a third factor that is the cause of MI. Say eating all those unhealthy snacks during the movie.


                And of course don’t forget your initial “gut feeling” cause-effect: watching horror movies is a cause of MI.


                Phew! That is a lot to think of. So what is important to remember? When designing your study to answer your question, you must always consider how to avoid spurious associations and concentrate on ruling out real associations that do not represent cause-effect. Especially those due to confounding.


                Take a break and watch the Chicken Game from Rebel Without a Cause and then listen to Rebel Music to calm down after the game of chicken. So is playing chicken with cars hurtling towards a cliff associated with death? Possibly. But in watching the clip you see that maybe there is a confounding factor… See it?


                Until next time in the blogosphere,


                Pascal Tyrrell

                If Only I Had A Brain…

                So how was March break? My family and I went to Stowe, Vermont for a little skiing. Awesome. However, the 8 hour drive with 3 kids, our luggage, skis, snowboards, and snacks to get there… maybe not so much. We felt a little like Dorothy in the The Wizard of Oz.

                Last time we were talking about p-values and inferential statistics (see Naked p-value if you don’t remember) and I mentioned that I would talk a little more about hypothesis testing. Now Ronald Fisher believed that if you obtained a large p-value when performing a statistical test then you would reject the null hypothesis. So the null hypothesis is always assumed to be true until shown to be false with a statistical test. This helps you determine the probability of seeing an effect as big or bigger than that in your study by chance alone if the null hypothesis were true. This is called significance testing.

                 
                Now two other great statisticians – Jerzy Neyman and Egon Pearson – were concerned about the possibility of rejecting a hypothesis that was obviously true. What if the statistical test at hand was NOT being applied correctly? So basically, it would be unreasonable to test whether your data is a certain way (significance testing) unless you assumed that there was other possibilities for your data. This became what is known as the alternative hypothesis. Interestingly, the probability of detecting that alternative hypothesis, if it is true, is called the power of the test. We will talk more about power later in the blog.
                 
                So the power of a statistical test is a measure of how good the test is. The more powerful of two tests is the better one to use. 
                 

                Here is an interesting thought: in many (most?) situations the statistical test you perform for the your study is to test the null hypothesis that no difference in effect exists between groups. In our previous example we were interested in whether gals or guys are associated with whether they like the Naked Gun movies or not in the population of blog readers. If no difference truly existed between gals and guys then why perform the study? The null hypothesis that both gals and guys equally like the Naked gun movies is a “straw man” meant to be knocked down by the results of your study. Therefore, you should always maximize the power of your study in order to knock down the straw man and show a difference exists between gals and guys.

                Ok. Now that we have worked up a sweat knocking down Scarecrow from the Wizard of Oz, cool down listening to Long December (yes, I am happy spring is around the corner) from the Counting Crows and…

                I’ll see you next time in the blogosphere.

                Pascal Tyrrell

                Acting 101 – Radiation Therapy Role Play Exercise

                Michael Douglas: actor extraordinaire!

                How is acting and radiation therapy related? Here at the Michener Institute, there are actual actors coming in to perform as our patients during patient care simulation and practical assessments. This is very helpful and fun at the same time as we get some experience with “patients” and if we make any mistakes, all can be corrected before going into the real world. This can spare us some embarrassment – the first time I talked with a patient actor, I could not think of what to say so “I am drawing a blank” just slipped out of my mouth! At the end of the debrief, the actor told me I could have just pretended to know by acting like The Thinker! Looking sophisticated and deep in thought.

                Beside the patient actors coming in, we also do role play in patient care labs – free acting lessons! Just the past Tuesday, we had a role play class for scenarios in patients with special needs. Some students are just natural actors/actresses, sometimes I wonder why they are not in acting. The class was very fun and educational and allowed us radiation therapy students to learn how the patients will react and how we can respond. Anyway, I wish I had video to show you how fun it was. If you are interested, you should apply to Michener next year and experience it yourself…

                Until next time,

                Gordon

                REsearch and Destroy!

                Why do we need to find out things, shouldn’t we be content with what we have already, why does research matter? Well, simply put, we conduct research because we are eager human beings looking to seek further knowledge into any task or question presented to us. Human beings in general are inquisitive beings that become fulfilled when they accomplish something and the information spectrum is broadened. To accomplish almost any goal, whether it be recreational or academic, information through research is required. Research essentially helps humans, be human. We question, research and come up with an answer, and that in itself is a true accomplishment.

                Research, like any other entity, has its ups and downs. You can follow the processes, look in the right books, but come up with the wrong information. When that happens, do not give up your search, rather organize it another way. Even if that seems to be time wasted, it was not, because the amazing thing about seeking knowledge is even if it’s the wrong knowledge found, one still learns from ANY obtained information. Research is a definite experience, and something valuable is ALWAYS learned when conducting research, whether it be the information being searched for, or a bit of self growth. And the best part? There is no time limit to knowledge. So get started. Just remember your keywords.

                Faith Balshin
                Check out MiVIP’s official twitter account! @MiVIP_UofT

                It’s Cold Out Today – Please Remember to Dress Your Naked P-Value…

                Ok, so you agree to dress your little friend before sending him/her out into the cold world of publication. But what is a p-value anyway? I realize that I am jumping the gun (pun intended) a little as it forces us to talk about inferential statistics – a challenging topic. So today I will only give you a small taste of what is to come. First, to get you in a good mood I want you to watch the trailer for the first of three hilarious Naked Gun movies.


                We have already talked about research questions and today I would like to introduce you to their children the research hypotheses. Essentially they are a version of their parents that summarize the main elements of a study – sample, predictor and outcome variables – in such a way that you are able to perform a test of statistical significance. These hypotheses are not required for descriptive studies like the ones we have been discussing in our blog so far. For instance if we were to ask how many people who read this blog enjoyed the Naked Gun series of movies we would end up with a proportion. We could then simply describe our findings as discussed in my Ogive post. 


                But what if you wanted to now if the proportion of gals differed from the proportion of guys who enjoyed the movies as you suspect that the type of humor will please guys more than gals? As we are research scientists we would want to test this “hypothesis” in order to compare the findings among the groups: this is a test of statistical significance. The brilliant statistician Ronald Fisher championed this approach. Only a single hypothesis is required: the null hypothesis. It simply states that no association of interest exists. So in this case whether you are a gal or a guy is not associated with whether you like the Naked Gun movies or not in the population of blog readers.


                Break! Listen to the music of P-value Diddy (he has so many names already I thought it ok to add one more) with Jimmy page from the Godzilla soundtrack.


                Welcome back. So the null hypothesis is always assumed to be true until shown to be false with a statistical test. When you analyze your data and perform the test you will determine the probability of seeing an effect as big or bigger than that in your study by chance alone if the null hypothesis were true. You would reject the null hypothesis  if the p-value is less than a predetermined level of significance – typically 5% or 1 in 20.


                So what is a naked p-value? It is simply a p-value obtained from the statistical test you performed on the data from your study reported WITHOUT an effect size, its sign and precision. The effect size is simply an estimate of the size of the association that you are studying – 25% more guys liked the movies as compared to the gals. The sign and precision is simply the direction of the observed difference (are you comparing gals to guys or the other way around) and an estimate of how confident you are – generally reported as a confidence interval which we will talk about in a later post.


                So what is the bottom line? In order to keep your p-value warm you need to report it with the measure of the size of the association (effect size) and how confident you are about your answer.


                In a subsequent post we will talk about another similar approach, Pearson-Neyman hypothesis testing, which involves two competing hypotheses (the null and the alternate hypotheses). This approach is duductive as opposed to Fisher’s inductive statistical testing approach. Both approaches are valid. It is simply a matter of determining which is more appropriate in a given situation.


                See you in the blogosphere,


                Pascal Tyrrell


                Are You My Type, Data?

                So you have come up with a research question and now you must chose a method by which your responses will be obtained. For example, a question like ‘Are you a Trekky?’ leads to a simple yes/no answer. So, are you? No need to fess up. I understand. Don’t know what I am talking about? See the trailer for my favorite of the Star Trek movies: The Wrath of Khan Trailer


                What if you were to ask, ‘How much of a Trekky are you?’. You are no longer able to use a simple two-category response but one that uses a continuous scale.


                An important distinction to remember when dealing with responses in research is that in general some will be categorical, such as favorite TV series, race, or marital status, and others continuous variables like blood pressure, cholesterol levels, or how much you enjoy Star Trek shows on a scale of 1 to 10 recorded on a 100 mm line. For those of you who would score high here listen to Santana – You are my kind as a reward.


                This brings us to the important concept of the level of measurement. If you are working with named categories – race for example – then you have a nominal variable. Categories that have an order to them – education level for example – are ordinal variables. What if the interval between your responses is fixed and known? Then you have an interval variable – temperature in Celcius or Fahrenheit is a good example. However, is zero degrees Celcius the same as zero degrees Fahrenheit? No. The latter is much colder! Now what if you are working in Kelvin which has a meaningful zero point? Then it is a ratio variable.


                Ok, so why the big deal? The important difference is between nominal/ ordinal data and interval/ ratio data. The latter two can be used in what is termed: “parametric statistics” that gives us measures of center (mean) and spread (standard deviation). We have already touched on this in previous posts. See here: Great Expectations. It makes no sense to talk about the average sex of a sample students in your study. These data must be considered as frequencies in separate categories. We previously talked about this a little here: Ogive and this type of data leads to “non-parametric” analysis. 

                Enough already! I’ll let you get back to streaming Star Trek re-runs…


                Next time lets talk a little about parametric statistics and how thy came to be. I’ll leave you with this quote as a teaser from one of the greatest statisticians to ever walk the earth – Ronald Fisher: “The analysis of variance is not a mathematical theorem, but rather a convenient method of arranging the arithmetic.”

                Pascal Tyrrell


                Pick me! Pick me! Pick me!

                So now that you are a debutante research scientist you are eager to take your newly acquired skills for a test drive. But where? You could get a job as a research assistant, but jobs are scarce. Apply for a student research summer scholarship. Maybe, but how about that summer job as a lifeguard at Camp North Star (from the crazy movie Meatballs) that you have committed to? 

                How about volunteering? But why would you do that? Let me tell you why. First listen to CeeLo Green to get pumped (yes, it is about firefighters but just pretend he is signing about volunteer scientists…).

                There are many, many, many reasons to be a volunteer for any organization in your community. I am certain you can think of a bunch within a short brain storming session. What I want to share with you is some of my reasons. I have volunteered with special needs in my community for most of my adult life (quick calculation puts me at about 5,000 hrs to date). People’s first reaction is that of surprise. What? How do you have the time? Then they think how admirable… Sure, I’ll take that. But really, I do it because it gives me opportunity. Opportunity to learn and grow. Not only am I happy to do it and it makes others happy doing it, but I accomplish something that I may not have had the opportunity to do otherwise. Think about that. Make others happy AND gain some experience in the process.

                Just like in the fantastic movie Shrek Donkey volunteers his services. He is always enthusiastic and willing to help. Listen to him ask to be picked here: Pick me! What does it get him in the end? A couple of great friends and a dragon wife. Perfect.

                Create opportunities for yourself by volunteering. You will be glad you did.


                Happy Valentine’s Day,

                Pascal Tyrrell