Hello everyone, my name is Wenda Zhao. I’m starting my fourth year in September majoring in neuroscience and pathobiology. I did a research opportunity project (ROP) 399 course with Dr. Tyrrell this summer. And I’m here to share some of my experiences with you.
Today is a hot and humid Friday in southeast China, where I’m back home from school for the rare luxury of a short break before everything gets busy again. Summer is coming to an end, so is my time with Dr. Tyrrell and his incredible team, some of whom I have got to know, spent most of the summer working with and befriend. I have just handed in my report for the project I did over the past three months on the segmentation, characterization and superimposition of dental
X-ray artifacts. And now, looking back, it was one of the best learning experiences I have ever had, through an enormous amount of self-teaching, practicing, troubleshooting, discussing and debating. As with all learning experiences, the process can be long and bewildering, sometimes even tedious; yet rewarding in the end.
It all began on a cold April morning, with me sitting nervously in Dr. Tyrrell’s
office, waiting for him to print out my ROP application and start off the interview. At that point, I just ended my one-year research at a plant lab and was clueless of what I was going to do for the following summer. Coming from a life science background, I went into this interview for a machine learning project in medical imaging knowing that I wasn’t the most competitive candidate nor the most suitable person to do the job. Although I tried presenting myself as someone who had had some experience dealing with statistics by showing Dr. Tyrrell some clumsy work I did for my previous lab, the flaws were immediately noticed by him. I then found myself facing a series of questions which I had no answers to and the interview quickly turned into what I thought to be a disaster for me. I was therefore very shocked when I received an email a week later from Dr. Tyrrell informing me that I had been accepted. I happily went onboard, but joys aside, part of me also had this big uncertainty and doubt that later followed me even to my first few weeks at the lab.
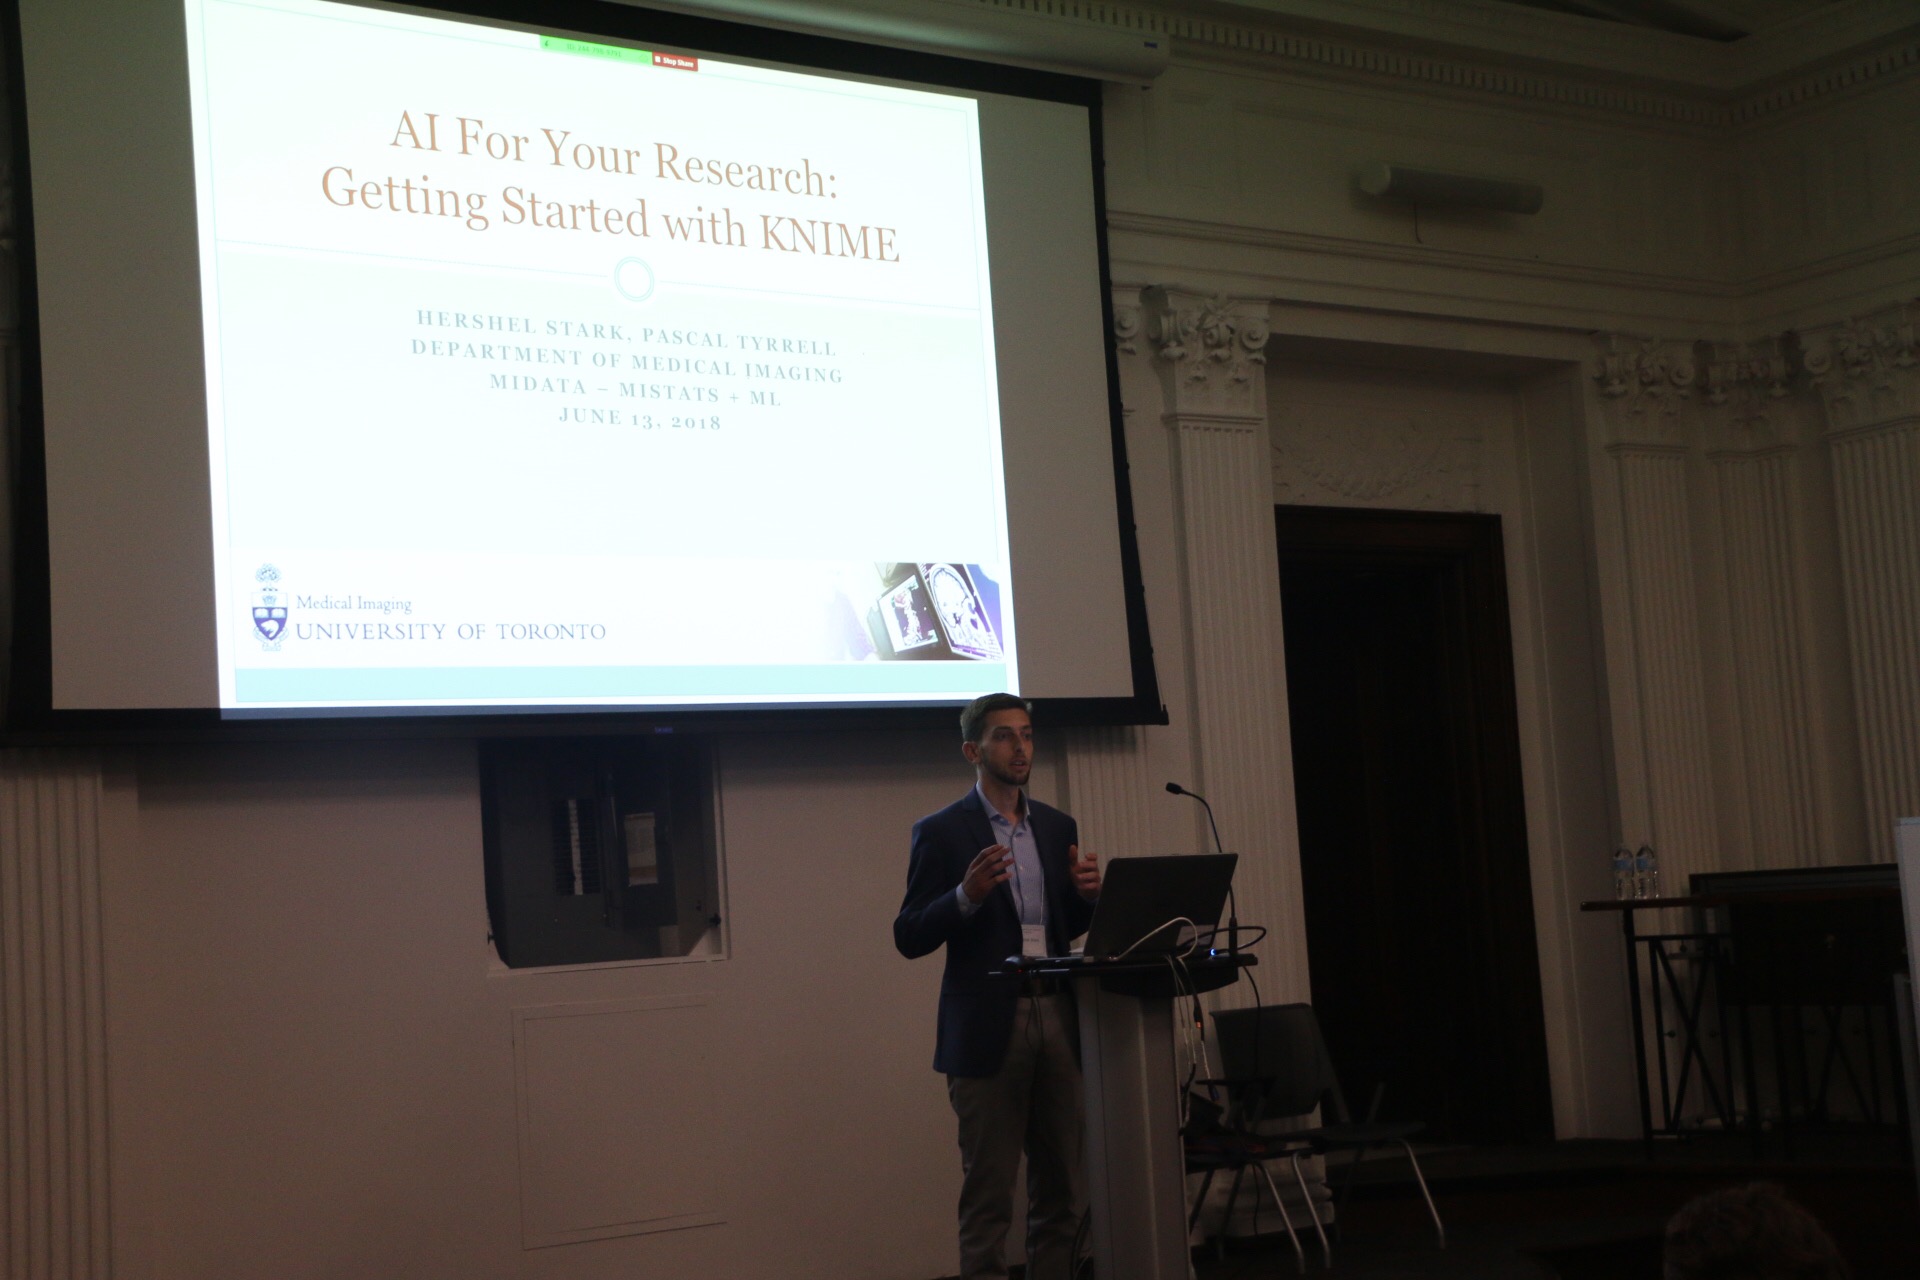
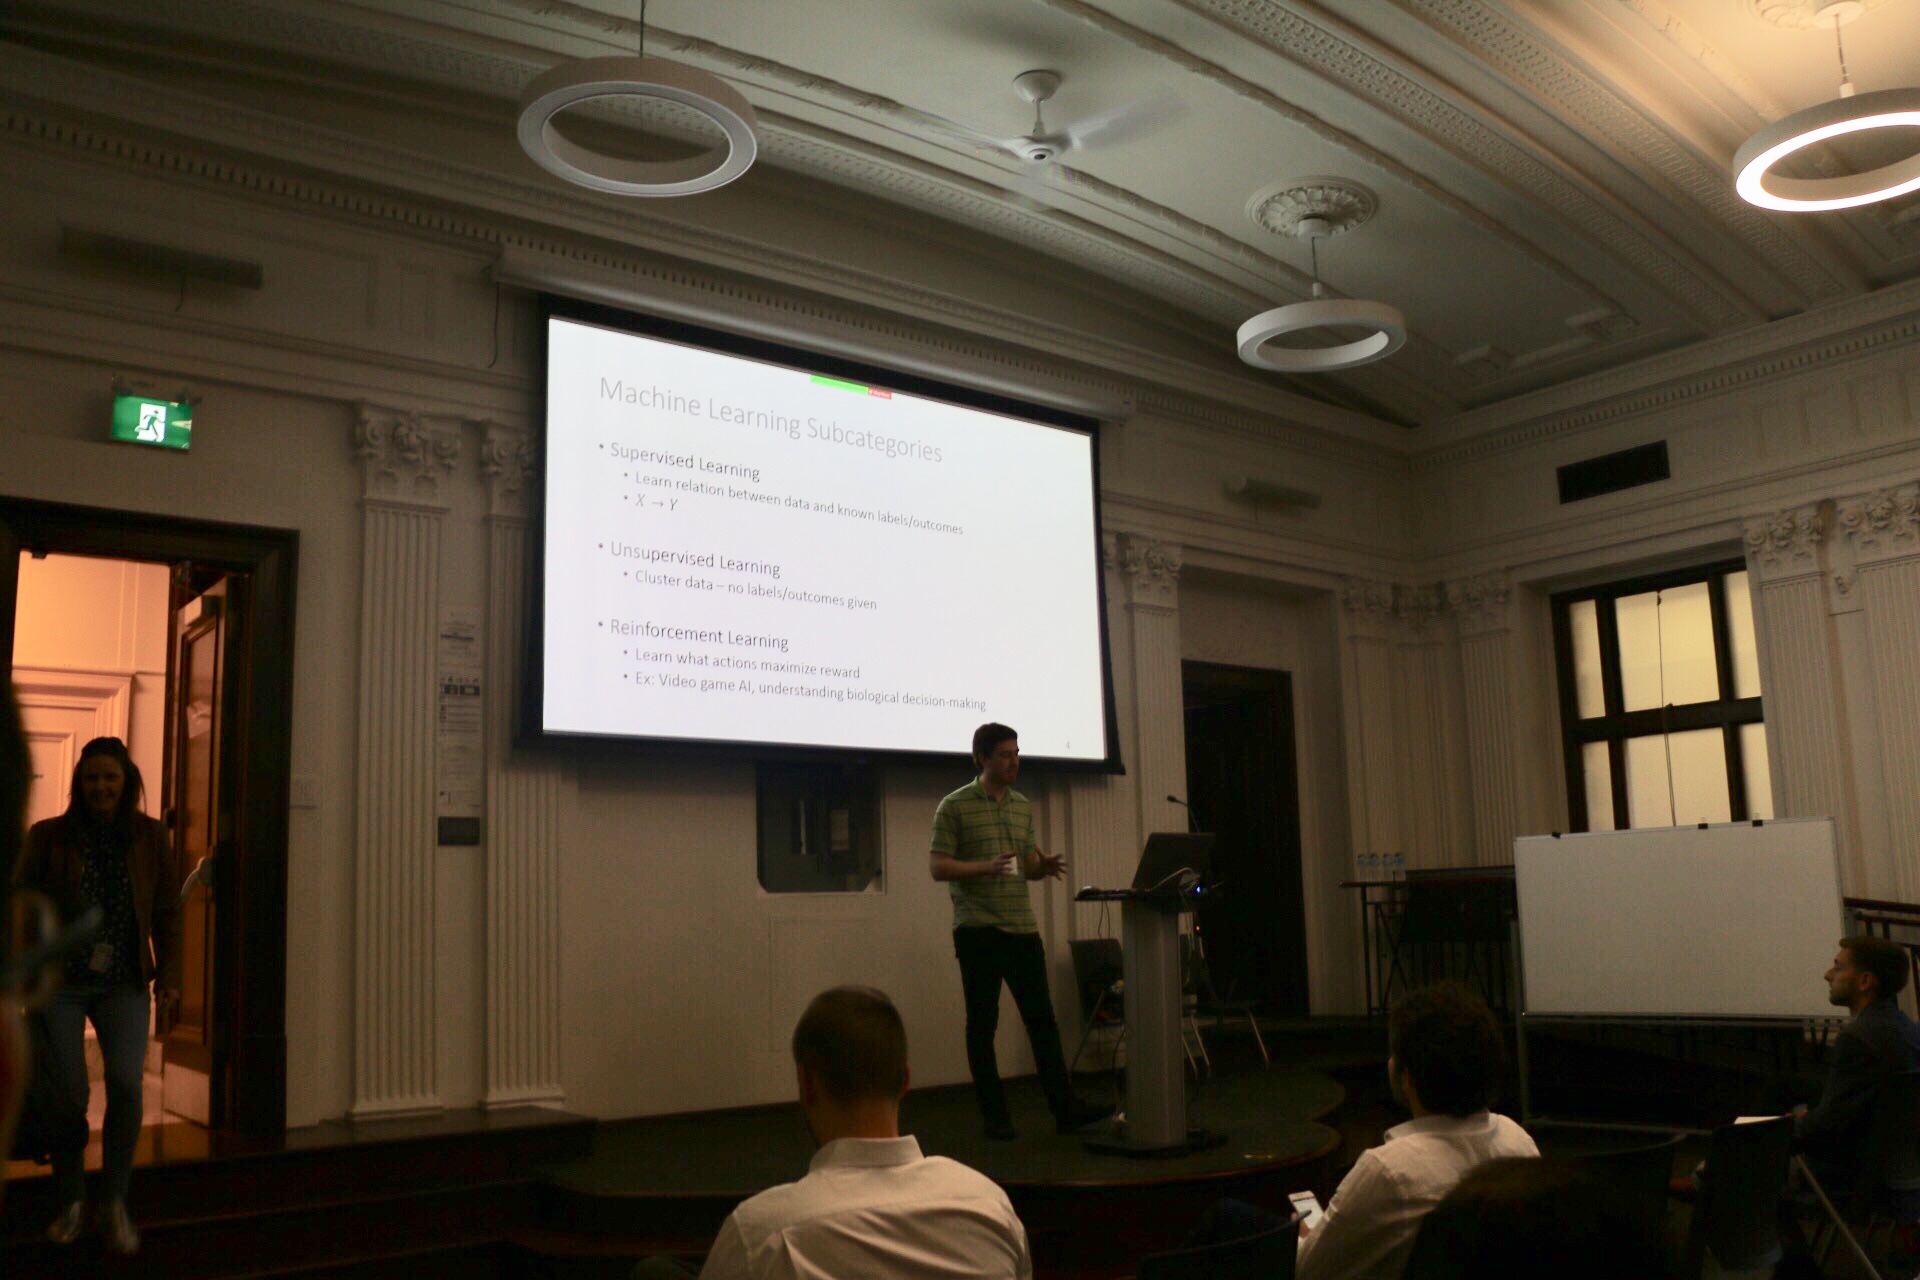
At the beginning, everything was new. I started off learning the software KNIME, an open-source data analytics platform that is capable of doing myriads of machine learning tasks. I had my first taste doing a classification problem, where we trained a decision tree model to identify a given X-ray to either be of a hand or a chest. It was a good introductory task to illustrate all the basic concepts in machine learning such as “training set”, “test set”, “input” and “output/label”. We ended up obtaining an accuracy of around 90% on the test set. That was the first time I witnessed the power of machine learning and I was totally amazed by it. I spent the next week or so watching more videos on the topic including state of the art algorithms such as convolutional neural network (CNN). While absorbing knowledge everyday was fun, I was at the same time a little lost about the future of my project. I began to realize that this experience is going to be very different from my past ones in wet labs, where a lot of the times you were already told what to do and all you need is to conduct the experiments and get the results. Here the amount of freedom that I have on my schedule, task and even the project itself was refreshing but at the same time terrifying. On retrospect, I considered myself lucky for that it was around that time of lost when the Faculty of Dentistry proposed a collaboration with us, which ended up being my project for the summer.
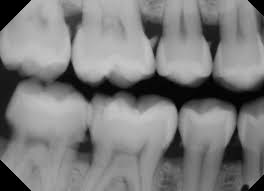
The dentistry project, as we so called, concerns a type of dental X-ray sensor called Phosphor Storage Plates (PSPs) which are very commonly used because of its easy placement in the oral cavity and the resulting minimum discomfort. The sensors, however, can accumulate damages over time, which would show up in the final image as artifacts with various appearances. Such artifacts could get in the way of diagnosis; thus, the plates need to be discarded before it’s too damaged. But how damaged is too damaged? For the moment, nobody has answers to that. Our goal is to use machine learning to learn the relationship between artifacts and whether they would affect diagnosis. Eventually, we can use that model to make predictions for a given plate and offer dentists advice as in when to discard it. The entire project is huge and the part we played in this summer mainly contributes as preparatory work. We segmented the artifacts from the image and clustered them into five groups based on 9 hand-engineered features. This characterization of the single artifacts can serve as the input for the model. We also created a library of superimposed images of artifact masks and real teeth backgrounds to mimic images taken with damaged sensors in real clinical settings. We did this so that dentists can take a look at these images and give a diagnosis. Comparing that with the true diagnosis, we can obtain the labels for whether a given artifact will affect diagnosis or not. And this will be the output of the model. The testing of these images is currently underway, and the results will be available in early September for further analysis.
With the project established and concrete goals ahead, the feeling of uncertainty
gradually went away. But it was never going to be easy. There were times when
we hit the bottleneck; when our attempts have failed miserably; when we had to give up on a brilliant idea because it didn’t go our ways. But after stumbling through all the challenges and pitfalls, we found ourselves new. I was a bit lost at the beginning of this summer. But over the summer I learned a lot about the very cool and growingly crucial field of machine learning; I grew a newfound appreciation for statistics and methodology; I picked up the programming language python, which I had been wanting to do for years and, most importantly, I did more thinking than I ever would if I were to just follow instructions blindly. And in the end, I believe that science is all about thinking. So for you guys out there reading the blog, if you’re coming to this lab from a totally different background and not entirely sure about the future, don’t be afraid. And I hope you find what you come here looking for, just like I did.
Finally, I want to thank the people who’s helped me along the way and who’s made the lab such an enjoyable place: Hershel, Henry, Rashmi, John and Trevor; and last but not least, Dr. Tyrrell, without whose kindly offer and guidance I would never have had such an amazing experience. Here’s to an unforgettable summer and a strong start of the new school year. Cheers!
Wenda Zhao