|
| ROP Research Forum March 5th, 2015 – Helena Lan |
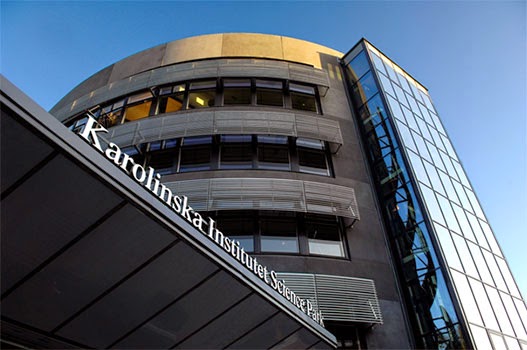
Helena is a second-year student pursuing a specialist in Pharmacology and Toxicology at the University of Toronto. Participating in ROP299 this past summer (see here) has opened many doors for her. She is currently assisting Pascal on a systematic review on research methodology and biostatistics in medical imaging, working as a research assistant for a medical education study, participating in the research abroad program at Karolinska Institutet this summer… and recently represented us at the March 5th, 2015 ROP research forum!
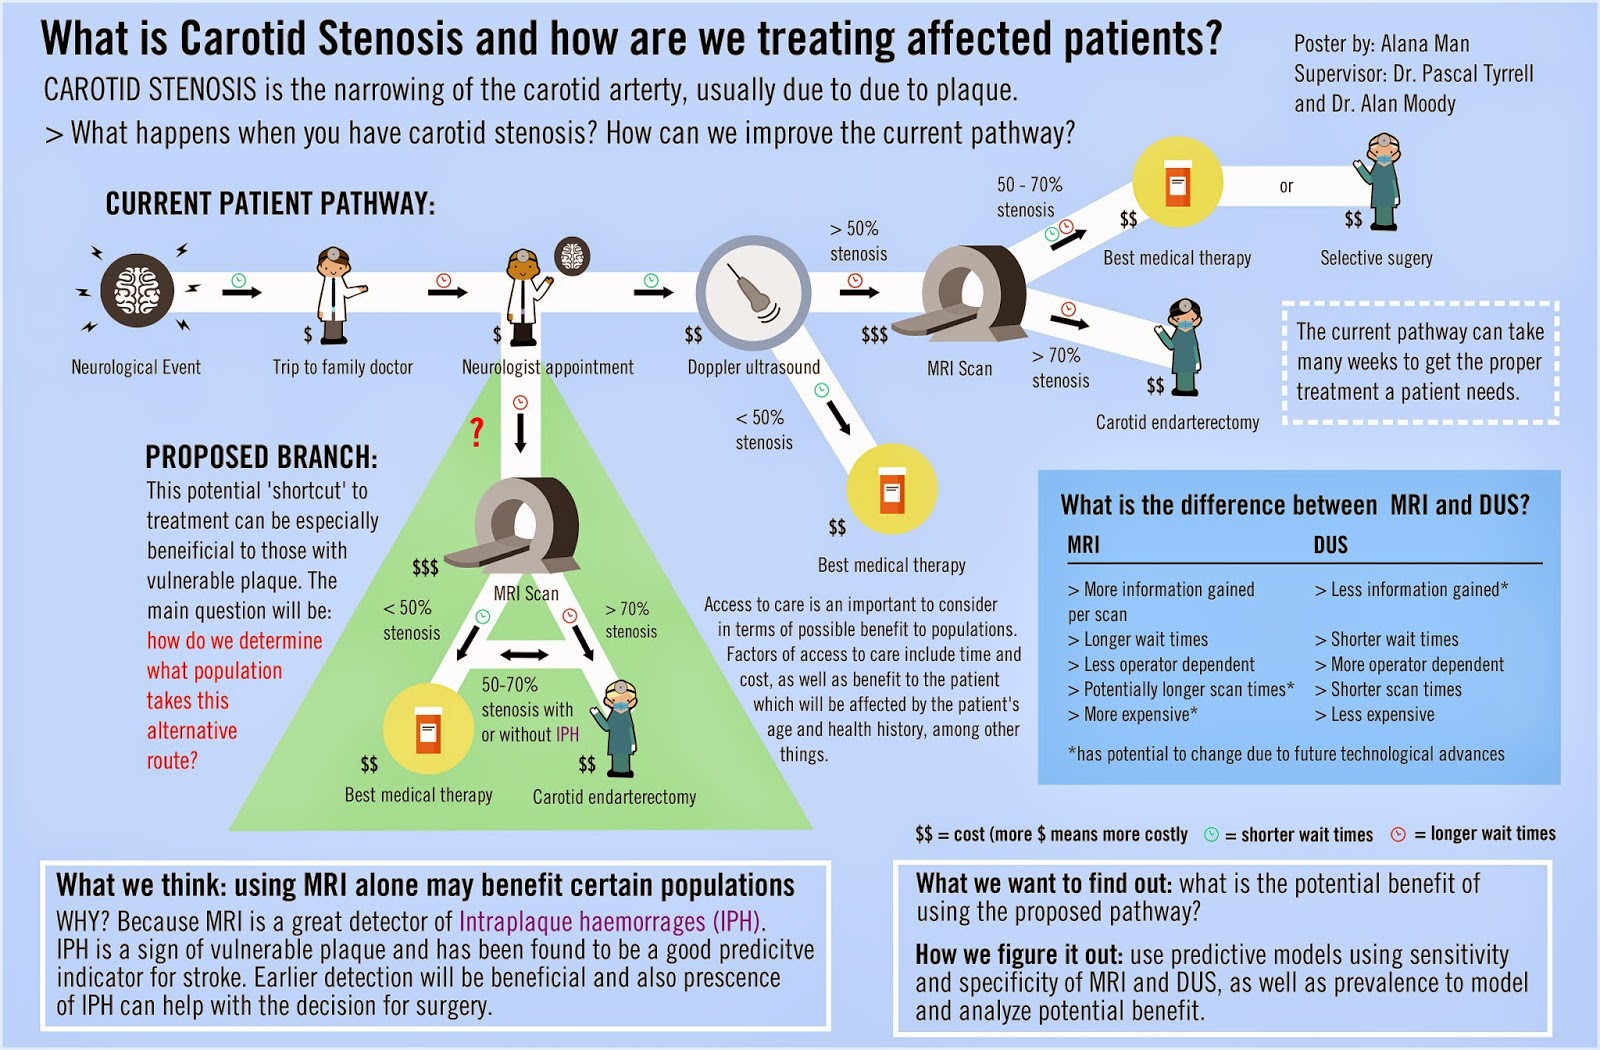
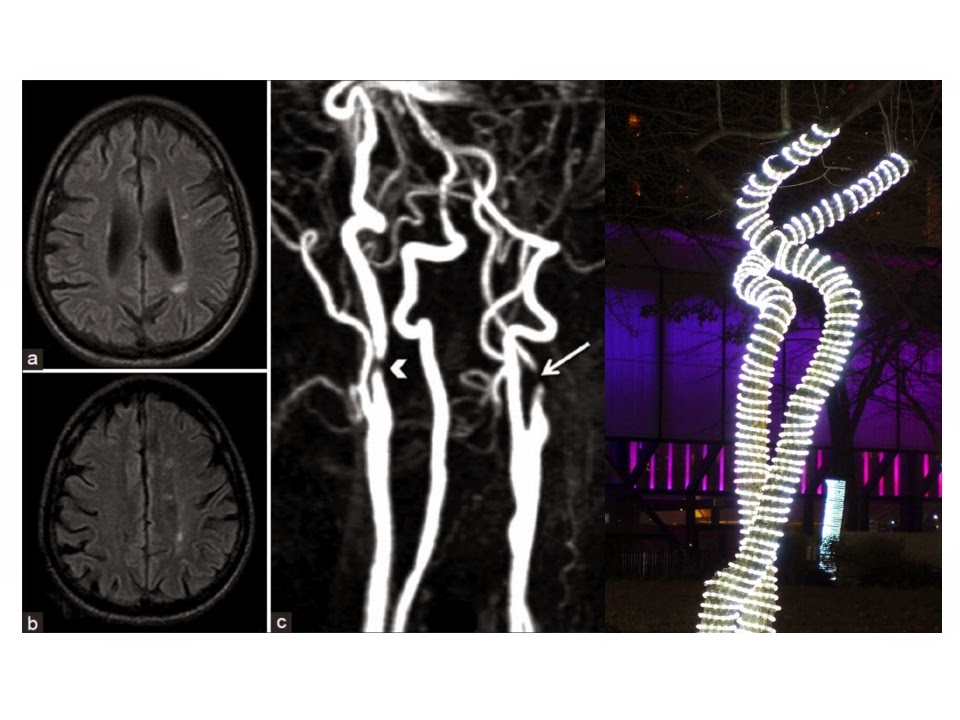
Helena examined the technical aspects and information provided by two major imaging modalities, MRI and ultrasound, for diagnosing carotid stenosis. She suggests that MRI holds great promise to serve as a cost effective test for carotid stenosis as well as a tool for assessing vessel health and plaque composition that would provide important information for patient management decisions.
Stay tuned, next Sylvia Urbanik will be talking about cost effectiveness…
See you in the blogosphere,
Pascal Tyrrell