The Ram-ifications of Risk


In the final installment of this series, I want to discuss how we can use the Ratios of Risk in a clinical context. To recap, we previously discussed an absolute measure of risk difference (appropriately called the risk difference or RD), as well as a relative measure of risk difference (relative risk or RR). 

To see how we can apply these risks, let’s tweak our original example. Let’s assume that smartphone thumb could potentially lead to loss of thumb function (not really, don’t worry!). Let’s also suppose that surgery is a possible treatment for smartphone thumb, and the following results were obtained after a trial.


Surgery
No Surgery (control)
Totals
Retained 
thumb function
7
6
13
Lost thumb function
3
4
7
Totals
10
10
20


The big question is: how good an option is surgery?
Let’s calculate the RD (note that the “risk” here is of losing thumb function): 4/10 – 3/10= 0.1

In other words, there is a 10% greater risk of loosing thumb function if you did not have the surgery. Based on this information alone (or by calculating the RR and OR), we might be quick to conclude that surgery is a great intervention.

But before we do that, let’s calculate another statistic, which will prove to be very useful: it’s called the number needed to treat (or NNT), and is given by 1/RD. The NNT is the number of patients that must be treated for 1 additional patient to derive some benefit (retain an intact and functioning thumb). In our case, NNT = 1/0.1 = 10. So, in order save 1 patient from loosing his thumb, another 9 will have had to undergo surgery with no apparent benefit. As you can see, the NNT sheds a very humbling light on our intervention. The ideal NNT is equal to 1. Beyond that, we must keep in mind that the additional patients undergoing the treatment have been exposed to all the negative side effects, without the intended benefit.

Throughout this series we discussed the meaning of risk, how it can be used for comparison (the various ratios of risk), and finally its application in a clinical setting (the ramifications of risk). After all these posts, smartphone thumb may have started to seem like a very real threat. But I think you should be fine…. as long as you know the risks!


So what’s up with the Dodge Ram ad (I am actually a F150 guy myself)? Well I just thought it went well with ramifications of risk. Cheesy I know. But who knows maybe it will help you to remember…


See you in the blogosphere,


Indranil Balki and Pascal Tyrrell

Happy New Year and Enjoy Some AR&R…

Or Attributable Risk Reduction…

First let me wish you all a fantastic New Year! Last year was crazy and I think this year is looking like it will be more of the same…


So in a previous post called Risky Business: Is It All Relative? we started talking about risk. We agreed that in lay terms a risk is generally associated with a bad event. However, a risk in statistical terms refers simply to the probability (usually statistical probability value between 0 and 1) that an event will occur, whether it be a good or a bad event.


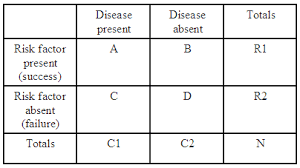
We also defined the risk of “smartphone thumb” as the number of new cases of smartphone thumb (the outcome) in a given period of time divided by the total number of people who own a smartphone (the exposure) and are at risk. This was called the cumulative incidence or absolute risk. Now what if we wanted to compare this risk to people who did not receive a smartphone for their birthday or Christmas for that matter? Let’s look at the results in a contingency table:


So, the absolute risk of smartphone thumb is A/(A+B) and similarly for those sad people without a smartphone their risk is C/(C+D). Now your chances of developing smartphone thumb are not necessarily 0 as maybe you are an avid gamer and play a little too much Xbox on the weekends. The reduction in risk can be expressed as the risk difference (also called the attributable risk reduction – ARR) and can be calculated as RD = A/(A+B) – C/(C+D). We can also estimate the proportion of cases of smartphone thumb among smartphone users that can be attributed to smartphone use by calculating the attributable risk percent: [RD/ A/(A+B)] x 100.


Let’s say 20% of smartphone users develop smartphone thumb whereas only 10% or non-smartphone users do. The RD is then equal to 10% (0.2 – 0.1 *100). The reduction in the chances of experiencing smartphone thumb who own a smartphone is the AR% which in this case is 50% (0.1/0.2*100).

That was easy. What’s next? Well, what if we want to know how many times more likely is it for a smartphone user to develop smartphone thumb than for a non-smartphone user? Let’s talk about that next post.


For now, decompress listening to “Under my Thumb” by the Rolling Stones. Classic…


See you in the blogosphere,


Pascal Tyrrell

Risky Business: Is It All Relative?

Now this movie takes me back a few years. Tom Cruise’s first big movie Risky Business. His underwear dance scene is pretty famous (haven’t scene it yet? Have a gander here). 


So what does Tom Cruise in underwear have anything to do with our blog? Well it is the concept of risk that interests me today. David Streiner was a fantastic professor of mine and is the author of many great stats publications. He talks about risk here. I will endeavor to do the topic justice with his help over the next few posts.


What do we mean when we talk about risk? In lay terms a risk is generally associated with a bad event. However, a risk in statistical terms refers simply to the probability (usually statistical probability value between 0 and 1) that an event will occur, whether it be a good or a bad event. 


Now that you are clear on that, you are probably wondering what are the best ways of describing risk or – better yet – comparing estimates or risk between groups (wondering what a statistical estimate is? See my earlier post here).  


Let’s say that you have just received the latest and greatest smartphone for your birthday and you can’t wait to text everyone you know to tell them about it. This would be considered the exposure: your smartphone. The outcome would be “smartphone thumb”: a painful thumb resulting from smartphone overuse (don’t believe me? See here). We can define the risk of smartphone thumb as the number of new cases of smartphone thumb (the outcome) in a given period of time divided by the total number of people who own a smartphone (the exposure) and are at risk. This is also called the cumulative incidence or absolute risk


As you have an inquisitive mind, you are now wondering what would be the difference in levels between conditions: people with a smartphone compared to people without. Well this can be expressed as absolute differences in risk or relative changes in risk and I will have mercy and address this in more detail… next post! 


For now, decompress by listening to the Barenaked Ladies singing Pinch me (believe it or not this song has something in common with Tom Cruise from Risky Business. Get it yet?).


See you in the blogosphere,


Pascal Tyrrell