Linxi Chen’s STA399 Journey

Hi everyone! My name is Linxi Chen and I’m finishing my third year at the University of Toronto, pursuing a statistics specialist and a mathematics major. I did an STA399 research opportunity program with Professor Pascal Tyrrell from May 2021 – August 2021 and I am very grateful that I can have this opportunity. This project provided me an opportunity in understanding machine learning and scientific research. I would love to share my experience with you all.

Initially, I had no experience with machine learning and convolutional neural network and integrating machine learning with medical imaging was a brand-new area for me. Therefore, at the beginning of this project, I searched loads of information on machine learning to gain a general picture of this area. The first assignment in this project was to make a slide deck on machine learning in medical imaging. Extracting and simplifying the gathered information helped me understand this area more deeply. 

My research project is to find out an objective metric for heterogeneity and explore how dataset heterogeneity will affect heterogeneity as measured by the CNN training image features with sample size. At first, how to specifically define the term “heterogeneity” was a big challenge for me, since there are various kinds of definitions on Google and there was so little information that was directly related to my project. By comparing the information on websites and talking with Professor Tyrrell in the weekly meeting, I managed to define the term “between-group heterogeneity” as the extent to which the measurements of each group vary within a dataset, considering the mean of each subgroup and the grand mean of the population. Next, designing the experiment setup was also challenging, because I have to ensure the experiment steps are applicable and explicable. The datasets were separated into different groups according to the label of each image. We introduced new groups into the dataset while keeping the total sample size the same in each case. There was a total of four cases and the between-group heterogeneity was measured using Cochran’s Q which is a test statistic based on chi-squared distribution. The experiment setup was modified several times, because problems came up from time to time. For example, I planned to use multi-classification CNN model at first, but it showed that I have to use different number of output neurons for the model in different cases, which made the results not comparable. Professor Tyrrell and Mauro suggested I use a binary-classification model with pseudo label, which successfully solved this problem. Luckily, I found some code on the website and with the help of Mauro, I managed to come up with the code that was applicable to use. Next came the hardest part that I encountered. Although idealistically my expectation could be explained very well, still the output results I got were not what I expected. After modifying the model and the sample size several times, I finally managed to get the expected results.

Overall, I have learned a lot from this ROP program. With the guidance of Professor Tyrrell and the help of students in the lab, I have gained an in-depth understanding of machine learning, neural network and the process of scientific research. Also, I have become more familiar with writing a formal scientific research paper. The most valuable thing that I got from this experience is the ability of problem-solving and never be frustrated when things get wrong. I would like to thank Professor Tyrrell for giving me this opportunity to learn about scientific research and helping me overcome all the challenges that I encountered during this process. I’m very grateful that I have gained so many valuable skills in this project. Also, I would like to thank Mauro and all the members in the lab for giving me so much help with my project.

Linxi Chen

MiWORD of the Day Is… Heterogeneity!

Today we are going to talk about the variation within a dataset, which is different from the term “pure variance” that we commonly use. So, what exactly is heterogeneity? 

There are three different kinds of data heterogeneity within the dataset: clinical heterogeneity, methodological heterogeneity, and statistical heterogeneity. Inevitably, the observed individuals in a dataset will differ from each other, which from the perspective of medical imaging, a set of images might be different from the average pixel intensities, RGB values, border on the images, and so on. Therefore, any kind of variability within the dataset is likely to be termed heterogeneity. 

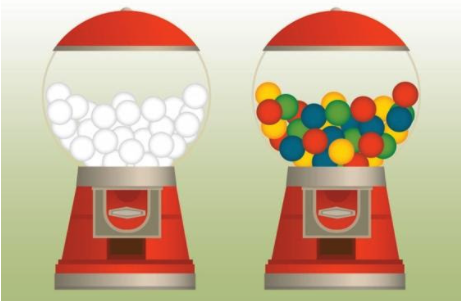
However, there are some differences between variance and heterogeneity. If a population has lots of variance, it only means that there are a lot of differences between the grand mean of the population and the individuals. Variance is a measure of dispersion, meaning how far a set of numbers is spread out from their average value. However, with respect to data heterogeneity, it means that there are several subpopulations in a dataset, and these subpopulations are disparate from each other. Therefore, we consider the between-group heterogeneity which represents the extent to which the measurements of each group vary within a dataset, considering the mean of each subgroup and the grand mean of the population. 

Chart, box and whisker chart

Description automatically generated
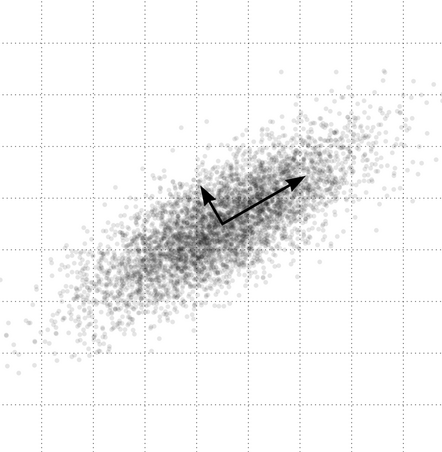
Chart, scatter chart

Description automatically generated

For example, if we are studying the height of a population, it is expected that the height of people from different regions (e.g., north, south, east, west of Canada) will be disparate from each other. If we separate the population into groups according to the region, we can calculate heterogeneity by measuring the variation of height between each group. If a population has a high value of heterogeneity, it will cause some problems to model training, causing a low testing accuracy.

Now for the fun part, using heterogeneity in a sentence by the end of the day!

Serious: The between-group heterogeneity in the training dataset made some negative impacts to the model training and therefore resulted in low testing accuracy.

Less serious: Today’s dinner was so wonderful! We had stewing beef, fried chicken, roasted lamb, and salads. There is so much heterogeneity in today’s dinner!

See you in the blogosphere!

Linxi Chen

Stanley Hua in ROP299: Joining the Tyrrell Lab during a Pandemic

My name is Stanley Hua, and I’ve just finished my 2nd year in the bioinformatics program. I have also just wrapped up my ROP299 with Professor Pascal. Though I have yet to see his face outside of my monitor screen, I cannot begin to express how grateful I am for the time I’ve been spending at the lab. I remember very clearly the first question he asked me during my interview: “Why should I even listen to you?” Frankly, I had no good answer, and I thought that the meeting didn’t go as well as I’d hoped. Nevertheless, he gave me a chance, and everything began from there.

Initially, I got involved with quality assessment of Multiple Sclerosis and Vasculitis 3D MRI images along with Jason and Amar. Here, I got introduced to the many things Dmitrii can complain about taking brain MRI images. Things such as scanner bias, artifacts, types of imaging modalities and prevalence of disease play a role in how we can leverage these medical images in training predictive models.

My actual ROP, however, revolved around a niche topic in Mauro and Amar’s project. Their project sought to understand the effect of dataset heterogeneity in training Convolutional Neural Networks (CNN) by cluster analysis of CNN-extracted image features. Upon extraction of image features using a trained CNN, we end up with high-dimensional vectors representing each image. As a preprocessing step, the dimensionality of the features is reduced by transformation via Principal Component Analysis, then selecting a number of principal components (PC) to keep (e.g. 10 PCs). The question must then be asked: How many principal components should we use in their methodology? Though it’s a very simple question, I took way too many detours to answer this question. I looked at the difference between standardization vs. no standardization before PCA, nonlinear dimensionality reduction techniques (e.g. autoencoder) and comparisons of neural network image representation (via SVCCA) among other things. Finally, I proposed an equally simple method for determining the number of PCs to use in this context, which is the minimum number of PCs that gives the most frequent resulting value (from the original methodology).

Regardless of the difficulty of the question I sought to answer, I learned more about practices in research, and I even learned about how research and industry intermingle. I only have Professor Pascal to thank for always explaining things in a way that a dummy such as me would understand. Moreover, Professor Pascal always focused on impact; is what you’re doing meaningful and what are its applications?

 I believe that the time I spent with the lab has been worthwhile. It was also here that I discovered that my passion to pursue data science trumps my passion to pursue medical school (big thanks to Jason, Indranil and Amar for breaking my dreams). Currently, I look towards a future, where I can drive impact with data; maybe even in the field of personalized medicine or computational biology. Whoever is reading this, feel free to reach out! Hopefully, I’ll be the next Elon Musk by then…

Transiently signing out,

Stanley Bryan Z. Hua