Happy New Year and Enjoy Some AR&R…

Or Attributable Risk Reduction…

First let me wish you all a fantastic New Year! Last year was crazy and I think this year is looking like it will be more of the same…


So in a previous post called Risky Business: Is It All Relative? we started talking about risk. We agreed that in lay terms a risk is generally associated with a bad event. However, a risk in statistical terms refers simply to the probability (usually statistical probability value between 0 and 1) that an event will occur, whether it be a good or a bad event.


We also defined the risk of “smartphone thumb” as the number of new cases of smartphone thumb (the outcome) in a given period of time divided by the total number of people who own a smartphone (the exposure) and are at risk. This was called the cumulative incidence or absolute risk. Now what if we wanted to compare this risk to people who did not receive a smartphone for their birthday or Christmas for that matter? Let’s look at the results in a contingency table:


So, the absolute risk of smartphone thumb is A/(A+B) and similarly for those sad people without a smartphone their risk is C/(C+D). Now your chances of developing smartphone thumb are not necessarily 0 as maybe you are an avid gamer and play a little too much Xbox on the weekends. The reduction in risk can be expressed as the risk difference (also called the attributable risk reduction – ARR) and can be calculated as RD = A/(A+B) – C/(C+D). We can also estimate the proportion of cases of smartphone thumb among smartphone users that can be attributed to smartphone use by calculating the attributable risk percent: [RD/ A/(A+B)] x 100.


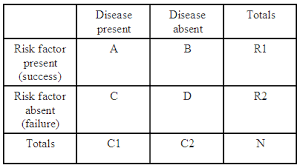
Let’s say 20% of smartphone users develop smartphone thumb whereas only 10% or non-smartphone users do. The RD is then equal to 10% (0.2 – 0.1 *100). The reduction in the chances of experiencing smartphone thumb who own a smartphone is the AR% which in this case is 50% (0.1/0.2*100).

That was easy. What’s next? Well, what if we want to know how many times more likely is it for a smartphone user to develop smartphone thumb than for a non-smartphone user? Let’s talk about that next post.


For now, decompress listening to “Under my Thumb” by the Rolling Stones. Classic…


See you in the blogosphere,


Pascal Tyrrell

Risky Business: Is It All Relative?

Now this movie takes me back a few years. Tom Cruise’s first big movie Risky Business. His underwear dance scene is pretty famous (haven’t scene it yet? Have a gander here). 


So what does Tom Cruise in underwear have anything to do with our blog? Well it is the concept of risk that interests me today. David Streiner was a fantastic professor of mine and is the author of many great stats publications. He talks about risk here. I will endeavor to do the topic justice with his help over the next few posts.


What do we mean when we talk about risk? In lay terms a risk is generally associated with a bad event. However, a risk in statistical terms refers simply to the probability (usually statistical probability value between 0 and 1) that an event will occur, whether it be a good or a bad event. 


Now that you are clear on that, you are probably wondering what are the best ways of describing risk or – better yet – comparing estimates or risk between groups (wondering what a statistical estimate is? See my earlier post here).  


Let’s say that you have just received the latest and greatest smartphone for your birthday and you can’t wait to text everyone you know to tell them about it. This would be considered the exposure: your smartphone. The outcome would be “smartphone thumb”: a painful thumb resulting from smartphone overuse (don’t believe me? See here). We can define the risk of smartphone thumb as the number of new cases of smartphone thumb (the outcome) in a given period of time divided by the total number of people who own a smartphone (the exposure) and are at risk. This is also called the cumulative incidence or absolute risk


As you have an inquisitive mind, you are now wondering what would be the difference in levels between conditions: people with a smartphone compared to people without. Well this can be expressed as absolute differences in risk or relative changes in risk and I will have mercy and address this in more detail… next post! 


For now, decompress by listening to the Barenaked Ladies singing Pinch me (believe it or not this song has something in common with Tom Cruise from Risky Business. Get it yet?).


See you in the blogosphere,


Pascal Tyrrell

Just in the Nick of Time… Causality.

Now that was a great movie: Interstellar. See the trailer here for a refresher. So this movie talked a lot about worm holes – essentially an area of warped spacetime. Theoretically a worm hole could allow time travel. Want to know more? Grab a large coffee and see here. You may be thinking what all this has to do with medical imaging but, believe it or not, I posted about x-rays in space earlier in the blog (see here).

Listen to Hans Zimmer’s – Time from the movie Inception (another great movie) to get into the mood.

Now, we have been talking about Bradford Hill’s criteria for causality and today we are addressing the fourth one: temporality. The exposure of your association of interest should always precede in time the outcome.  If factor “A” is believed to cause a disease,  then factor “A” must necessarily always precede the occurrence of the disease. So for example the act of smoking (or being exposed to second-hand smoke) must precede the development of lung cancer for the relationship to be considered causal. This is the only absolutely essential criterion (out of nine).

Easy one, right? Next time I will be talking about biological gradient.


I am not sure you need time to decompress today as it has not been too taxing… but listen to Bonnie Raitt Nick of Time anyway…

… and I’ll see you in the blogosphere.

Pascal Tyrrell

Be More Specific… Or It May Not Be Causal?!!!

Well, if you are relaxed and heading nowhere in particular then I guess you probably won’t be too concerned with showing causality either. In our past few posts we have been discussing Bradford Hill’s criteria for determining causality (see Strength and Consistency for a refresher). If you are stressed out already, have a listen to “Come the morning” from an up and coming Canadian artist from Winnipeg, Manitoba – Sebastian Owl – before reading on.


Today we will talk about the third of the nine Hill criteria: Specificity

 
When considering the specificity of the association of interest, we wish to establish whether a single putative cause produces a specific effect. When specificity of an association is found, it provides additional support for a causal relationship.  But keep in mind that very often the effect under investigation may have more than one cause. So the absence of specificity in no way negates a causal relationship. This criterium of Hill’s is considered to be the least important and can often be over-ruled in the case of multi-causal relationships.


Next, post we will talk about the oh-so-important criterium: temporality.


If you are nowhere in particular then you are not being specific to your whereabouts – right? Anyway, why don’t you watch this great Film festival short by Mason Cardiff, Nowhere in particular, to decompress and…


… I’ll see you in the blogosphere.


Pascal Tyrrell

Consistent Associations May Be Causal Ones…?

Do you remember the Rain Man movie with Dustin Hoffman and Tom Cruise? Great movie that introduced Savant Syndrome to theater audiences all over the world. The savant syndrome is a rare condition in which persons with autistic disorder or other mental disabilities have extraordinary skills that stand in stark contrast to their overall handicap. There is a very interesting documentary on Kim Peeks who was the inspiration for the movie here. Anyway, last post we talked about strength – one of Bradford Hill’s criteria for causation (see here for a refresher). Today we will talk about consistency, a good qualifier for the often obsessive and ritualistic behaviors of autistic savant persons.


An association between two entities is consistent when results are replicated in multiple studies in different settings using different methods. So if a relationship is causal, we can expect to find it consistently in different studies and among different populations.  This implies that many studies need to be done before meaningful statements can be made about any causal relationship.


A great example of this is the long debated causal relationship between smoking cigarettes and lung cancer. It took hundreds, if not thousands of highly technical studies and many, many publications before a definitive conclusion could be made that cigarette smoking increases the risk of cancer and in a causal manner (see here for a statement from the CDC Surgeon General).  


So be consistent in your smoking cessation and you will consistently avoid the risk of lung cancer…


Next post we will tak about Bradford’s third criterium: specificity.


Relax listening to the very eighties styled theme music to Rain Man and…


… I’ll see you in the blogosphere.


Pascal Tyrrell

Causality and Who’s Running Up That Hill?

Yes, back to the eighties. They were my high school and undergrad years – so very memorable! This song – Running Up That Hill – by Kate Bush was her first great hit from that time.


So, why was she running up that hill you ask? Well, it was because she had finally come to realize the importance of establishing the minimal conditions needed to establish a causal relationship between two entities, of course! Somewhat like the story of Archimedes who leapt from his bath yelling “Eureka” in excitement having discovered a law of physics that would later become the building block to fluid mechanics (see Archimedes principle).


In 1965 (no, I was not born yet – but just!), Austin Bradford Hill a British medical statistician proposed minimal conditions needed to establish a causal relationship between two entities. These later became know as the Hill’s Criteria. Very often people get the relationship of association confused with that of causality. See my previous post Rebel Without a Cause for some insight on when an association can be considered as cause and effect.


Today we will talk about the first of the nine Hill criteria: Strength


– The strength of an association is defined as the size of a given association as measured by appropriate statistical tests.  The stronger the association, the more likely it is that the relation between the two entities of interest is cause and effect.  For example, the more highly correlated hypertension is with smoking, the stronger is the relation between the exposure, smoking, to the outcome, hypertension. Though we cannot be sure of the direction of the relationship (this will be achieved when we discuss Temporality) – as hypertension could hypothetically lead subjects to smoke – we can certainly decide that the strength of the association observed supports our argument of causation.


Look at that, we have completed the first criterium all ready! Next we will look at Consistency.


Have a listen to “Strength Of A Women” by Shaggy to recover from today’s fun and…


… I’ll see you in the blogosphere.


Pascal Tyrrell