MiWord of the Day Is… Pentimenti!

What!!? Do you find it on pizza or in the middle of green olives? Well actually, it is a word of Italian origin and describes minor changes in a painting during its composition. So, similar to erasing some of your hand writing and then writing over it again with the corrected text. I guess for you younger folk it would be like pressing back-space and then re-typing! The difference of course is that there would NOT be any pentimenti as there would no trace of your previous attempt…


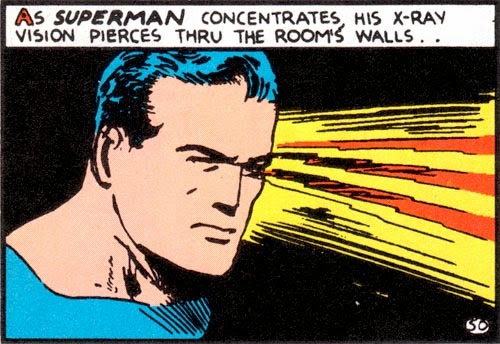
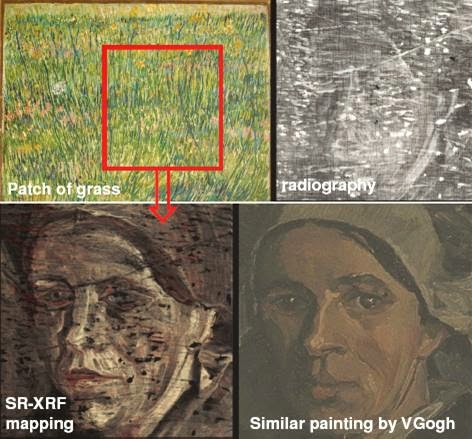
So what does this have to do with medical imaging? In our last Mi word of the day we talked about x-rays. Now, today we take x-rays and our ability to peer inside the human body for granted. So what else can we see with x-rays? Believe it or not x-rays can also help to reveal how a painting evolved from first brush strokes to finished product. X-ray analysis can help to describe the paint composition to the different layers that may exist in the painting.


Consider, for example, “Patch of Grass” by Van Gogh seen above. It was discovered by x-ray analysis that this 1887 painting completely concealed a portrait of a woman that Van Gogh had painted over. He often did this to save money on canvases (maybe to buy Absinthe – how naughty!). In this case, in addition to Van Gogh’s pentimenti is his habit of painting over previous works. All of this adds to a type of “fingerprint” that art appraisers use to identify works of art from forgeries… Cool.

Today, we have to use “pentimenti” in a sentence (see rules here). Here are two examples to help you along:

Serious: I wonder how Van Gogh’s pentimenti differs from that of Rembrandt. Maybe I should ask the Musee du Louvre’s curator for some insight.

 
Not so serious: Yes, I would like to order a large pizza with pentimenti, double cheese, and mushrooms. No pentimenti? Alright, pepperoni works just as well…


See you in the blogosphere,


Pascal Tyrrell

Breaking Up Is Hard to Do

Last week I met with Helen, a clinical investigator program radiology resident from our department, about her research (shout out to Dr Laurent Milot’s research group). When discussing predictors and outcomes for her retrospective study it was suggested that some continuous variables be broken up into levels or categories based on given cut-points. This practice is often encountered in the world of medical research. The main reason? People in the medical community find it easier to understand results that are expressed as proportions, odds ratio, or relative risk. When working with continuous variables we end up talking about parameter estimates / beta weights and such – not as “reader friendly”. 


Unfortunately, as Neil Sedaka sang about in his famous song Breaking Up Is Hard to Do, by breaking up continuous variables you pay a stiff penalty when it comes to your ability to describe the relationship that you are interested in and the sample size requirements (see loss of power) of your study.


You are now a newly minted research scientist (need a refresher? See Pocket Protector) and are interested in discovering relationships among variables or between predictors and outcomes. The more accurate your findings the better the description of the relationships and the better the interpretation/ conclusions you can make.The bottom line is that dichotomizing/ categorizing a continuous measure will result in loss of information. Essentially, the “signal” which is the information captured by your measure will be reduced by categorization and, therefore, when you perform a statistical test that compares this signal to the “noise” or error of the model (observed differences between your patients for example) you will find yourself at a disadvantage (loss of power)David Streiner (great author and great guy!) gives a more complete explanation in one of his papers.


Now, as we see in the funny movie with Vince Vaugh and Jennifer Aniston, The Break Up, there are times when categorization may make sense. For example when the variable you are considering is not normally distributed (see Are You My Type?) or when the relationship that you are studying is not linear. We will talk about these situations in a later post.


Don’t forget: you will get further ahead if you keep your variables as continuous data whenever possible.


See you in the blogosphere,


Pascal Tyrrell

MiWord of the Day Is… X-Ray!

Yup! Want some of that. Not only is Superman cool but he has x-ray vision. Unbelievable. Or is it? Radiologists have the same x-ray vision but without the Spandex suit – or at least they don’t wear it to work that I am aware of.


The word of the day is x-ray. You have already successfully used “Roentgen” in casual conversation last week (don’t know what I am talking about? See Mi Word of the Day Is… Roentgen!) and today I will talk a little about what Roentgen was first in measuring and describing – x-rays.


Let’s say you are in your lab and you are working with passing electrical discharges through vacuum tubes – a typical Saturday afternoon activity with friends. As chance would have it your little sister’s barium salts paintings happen to be drying near-by and you notice a faint glow emanating from them every time you run your experiments. No matter how much you try to block any light coming from your vacuum tubes the glow persists. What? That’s odd. How’s that happening? Well my friend, you have just crossed over into the Twilight Zone (awesome old tv series) and discovered a form of electromagnetic radiation.


Visible light is but a very small part of the electromagnetic spectrum. Moving from visible light to longer wavelengths and lower frequencies we find infrared (keeps food warm at restaurants), microwaves (to warm your pizza pop) and radio (not the one streamed through the internet!). 


Now if you move in the opposite direction from visible light you find shorter wavelengths with higher frequencies starting with ultraviolet (what helps you get that summer tan), x-rays (word of the day), and finally gamma rays (topic for another day!). So x-rays are about the size of atoms and radio waves the size of buildings. Crazy. I think what is surprising is that with the naked eye we “see” so little and yet so much (philosophy anyone?).


So, x-rays are short wavelength, high frequency, high energy electromagnetic radiation that is able to penetrate some substances more easily than others. For example, they penetrate flesh more easily than bone, and bone more easily than lead. Thus they make it possible to see bones within flesh and a bullet embedded in bone. The ability of X rays to penetrate depends on their wavelength and on the density and thickness of the substance being scanned.


Now if you remember the rules:


1- I introduce and discuss a word.
2- You have to use the word in a sentence by the end of the day. No need to use it in the correct context – actually out of context is more fun and elicits a more entertaining response!
 
 
Today, we have to use “x-ray” in a sentence. Here are two examples to help you along:

Serious: Hey Frank, did you know the radiation you received during your chest x-ray last week was actually “soft” x-rays? Ones with shorter wavelengths and more penetrating power are used for scanning archaeological artifacts.


Less serious: Frank! Dude, I got them! My x-ray specs just came in the mail. Let’s go the beach…

See you in the blogosphere,


Pascal Tyrrell

MiWord of the Day Is… Roentgen!

Welcome to the first Medical imaging Word of the Day! Here is how it works:


1- I introduce and discuss a word.
2- You have to use the word in a sentence by the end of the day. No need to use it in the correct context – actually out of context is more fun and elicits a more entertaining response!


OK, here we go. The word of the day is Roentgen – typically pronounced “Rent-gun”.

Wilhelm Roentgen was a physicist from northern Germany who in 1895 was the first to detect the now famous x-ray. Interestingly, he was not the first to produce them. The x-ray is part of the electromagnetic spectrum that contains shorter wavelengths (0.01 to 10 nm) than visible light (390-700 nm). We will talk about this in another post as today it is about Roentgen.

 
The interesting discovery was that it was a new kind of light – one that could not be seen but could be detected. Most importantly it gave physicians the ability to peer inside the body of a patient without having to cut it open – a camera that can see inside the body.
 
An interesting and maybe ironic fact is that Roentgen – the discoverer of a new way to “see” – was blind in one eye (from a childhood illness) and color blind
 
Here are some other interesting facts:
 
  • Following his discovery the “Roentgen unit” was described and used to measure x-ray exposure (one R is 2.58×10⁻⁴ C/kg). About 500 R over 5 hours is considered a lethal dose for humans.
  • Roentgen was the first scientist to receive the Nobel prize in physics in 1901. He refused to patent his discovery and gave the entire prize money to his university. Wow, what a guy!
  • He died of colon cancer in 1923.
 
So, now we have to use “Roentgen” in a sentence. Here are two examples:
 
Serious: Hey Frank, I see you just came back from having a chest x-ray. Did you know that you just received about 1/20 of a Roentgen? Oh, and I am glad to hear you don’t have pneumonia…
 
Not so serious: Hello, I will be travelling to Europe this summer and will need to exchange some Canadian dollars for Euros. Could you tell me the exchange rate? And while you’re at it, what is today’s rate on the Roentgen? Never heard of that currency? Really? It’s German I think…
 
 
OK, unbelievably I found a music link to Roentgen! Hyde produced an album named “Roentgen” and one of the main tracks is aptly called “Unexpected“. Yup, I’m serious…
 
 
See you in the blogosphere,
 
 
Pascal Tyrrell

You like potato and I like potahto… Let’s Call the Whole Thing Off!

We have been talking about agreement lately (not sure what I am talking about? See the start of the series here) and we covered many terms that seem similar. Help!


Before you call the whole thing off and start dancing on roller skates like Fred Astaire and Ginger Roberts did in Shall We Dance, let’s clarify a little the difference between agreement and reliability. 


When assessing agreement in medical research, we are often interested in one of three things:


1- comparing methods – à la Bland and Altman style.


2- validating an assay or analytical method.


3- assessing bioequivalence.


Agreement represents the degree of closeness between readings. We get that. Now reliability on the other hand actually assesses the degree of differentiation between subjects – so one’s ability to tell subjects apart from within a population. Yes, I realize this is a subtlety just as Ella Fitzgerald and Louis Armstrong sing about in the original Let’s Call the Whole Thing Off.


Now, often when assessing agreement one will use an unscaled index (ie a continuous measure for which you calculate the Mean Squared Deviation, Repeatability Standard Deviation, Reproducibility Standard Deviation, or the Bland and Altman Limits of Agreement) whereas when assessing reliability one often uses a scaled index (ie a measure for which you can calculate the Intraclass Correlation Coefficient or Concordance Correlation Coefficient). This is because a scaled index mostly depends on between-subject variability and, therefore, allows for the differentiation of subjects from a population. 


Ok – clear as mud. Here are some very basic guidelines:


1- Use descriptive stats to start with.


2- Follow it up with an unscaled index measure like the MSD or LOI which deal with absolute values (like the difference).


3- Finish up with a scaled index measure that will yield a standardized value between -1 and +1 (like the ICC or CCC).


Potato, Potahtoe. Whatever. 


Entertain yourself with this humorous clib from the Secret Policeman’s Ball and I’ll…

See you in the blogosphere!


Pascal Tyrrell

2 Legit 2 Quit

MC Hammer. Now those were interesting pants! Heard of the slang expression “Seems legit”? Well “legit” (short for legitimate) was popularized my MC Hammer’s song 2 Legit 2 Quit. I had blocked the memories of that video for many years. Painful – and no I never owned a pair of Hammer pants!


Whenever you sarcastically say “seems legit” you are suggesting that you question the validity of the finding. We have been talking about agreement lately and we have covered precision (see Repeat After Me), accuracy (see Men in Tights), and reliability (see Mr Reliable). Today let’s cover validity.


So, we have talked about how reliable a measure is under different circumstances and this helps us gauge its usefulness. However, do we know if what we are measuring is what we think it is. In other words, is it valid? Now reliability places an upper limit on validity – the higher the reliability, the higher the maximum possible validity. So random error will affect validity by reducing reliability whereas systematic error can directly affect validity – if there is a systematic shift of the new measurement from the reference or construct. When assessing validity we are interested in the proportion of the observed variance that reflects variance in the construct that the method was intended to measure.


***Too much stats alert*** Take a break and listen to Ice, Ice, Baby from the same era as MC Hammer and when you come back we will finish up with validity. Pants seem similar – agree? 🙂


OK, we’re back. The most challenging aspect of assessing validity is the terminology. There are several different types of validity dependent of the type of reference standard you decide to use (details to follow in later posts):


1- Content:  the extent to which the measurement method assesses all the important content.


2- Construct: when measuring a hypothetical construct that may not be readily
observed.


3- Convergent: new measurement is correlated with other measurements of the same construct.


4- Discriminant: new measurement is not correlated with unrelated constructs.

So why do we assess validity? because we want to know the nature of what is being measured and the relationship of that measure to its scientific aim or purpose.


I’ll leave you with another “seem legit” picture that my kids would appreciate…


See you in the blogosphere,


Pascal Tyrrell


Mr Reliable

Kevin Durant is Mr Reliable

Being reliable is an important and sought after trait in life. Kevin Durant has proven himself to be just that to the NBA. Would you agree (pun intended)? So, we have been talking about agreement lately and we have covered precision (see Repeat After Me) and accuracy (see Men in Tights). Today let’s talk a little about reliability.

 
As I mentioned last time, the concepts of accuracy and precision originated in the physical sciences because direct measurements are possible. Not to be outdone, the social sciences (and later in the Medical Sciences) decided to define their own terms of agreement – validity and reliability.
 
So the concept of reliability was developed to reflect the amount of error, both random and systematic, in any given measurement. For example if you were to want to assess the the measurement error in repeated measurements on the same subject under identical conditions or to measure the consistency of two readings obtained by two different readers on the same subject under identical conditions. 
 
The reliability coefficient is simply the ratio of variability between subjects to the total variability (sum of subject variability and measurement error). A coefficient of 0 indicates no reliability and 1 indicates perfect reliability with no measurement error.
 
Being Mr Reliable (see the trailer to this cool old movie from the sixties) is always desirable but keep in mind that when you consider reliability remember that:
 
1- A true score exists but is not directly measurable (philosophical…)
 
2- A measurement is always the sum of the true score and a random error.
 
3- Any two measurements for the same subject are parallel measurements in that they are assumed to have the same mean and variance.
 
 
With these assumptions in place, reliability can be also expressed as the correlation between any two measurements on the same subject – AKA the intraclass correlation coefficient or ICC (originally defined by Sir Francis Galton and later further developed by Pearson and Fisher). We will talk about the ICC in a later post.
 
Phew! That was a mouthful. All this talk of reliability is exhausting. Maybe Lean on me (or Bill Withers, actually) for a bit and we will talk about validity when we come back…


See you in the blogosphere,


Pascal Tyrrell

Men in Tights?

One of the first movies my parents took me to see was Disney’s Robin Hood in 1973. This was back in the days when movies were viewed in theaters and TV was still black and white for most people. One of Robin’s most redeeming qualities is his prowess as an archer. He simply never misses his target. Well maybe not so much in Mel Brook’s rendition of Robin Hood Men in Tights!


We have been talking about agreement lately and last time we covered precision (see Repeat After Me). We discussed that precision is most often associated with random error around the expected measure. So, now you are thinking: how about the possibility of systematic error? You are right. Let’s take Robin Hood as an example. If he were to loose 3 arrows at a target and all of them were to land in the bulls-eye then you would say that he has good precision – all arrows were grouped together – and good accuracy as all arrows landed in the same ring. Accuracy is a measure of “trueness”. The least amount of bias without knowing the true value.  Now if all 3 arrows landed in the same ring but in different areas of the target he would have good accuracy – all 3 arrows receive the same points for being in the same ring – but poor precision as they are not grouped together.


As agreement is a measure of “closeness” between readings, it is not surprising then that it is a broader term that contains both accuracy and precision. You are interested in how much random error is affecting your ability to measure something AND whether or not there also exists a systematic shift in the values of your measure. The first results in an increased level of background noise (variability) and the latter in the shift of the mean of your measures away from the truth. Both important when considering overall agreement.


OK, take a break and watch Shrek Robin Hood. The first of a series is always the best…


Now the concepts of accuracy and precision originated in the physical sciences. Not to be outdone, the social sciences decided to define their own terms of agreement – validity and reliability. We will discuss these next time after you listen to Bryan Adams – Everything I Do from the Robin Hood soundtrack. Great tune.


See you in the blogosphere,


Pascal Tyrrell

Michener Institute Series: Princess Margaret Hospital, Toronto, Ontario


As first year Radiation Thearpy students here a The Michener Institute, we are currently in our 4th week of clinical placements! As promised, here’s a little update about the experiences Jennifer and Ori are going through at Princess Margaret Hospital.

Jennifer: I’ve been placed in Unit 10 which specializes in treating patients with Genitourinary, Gynae and Lower Gastrointestinal cancer.

Ori: I’m on Unit 14 and we treat breast cancer and palliative cancers.

We are proud to say that we are enjoying our experience here. Our duty as students in training is to follow the radiation therapist and learn what they do. The job of a therapist is to treat cancer using a machine called Linear Accelerator (Linac) to deliver ionizing radiation. Patients will typically come once a day for the next couple of weeks, so we see the same patients every day and therefore really get to know our patients well. There is a fair amount of patient interaction, which is one of our favorite parts of the job. Along with patient interactions, we also get to use the equipment, which mainly includes operating the Linac machine (the machine that delivers the radiation) and taking X-rays or CT scans to make sure the patient is in the right position. Every day is a new experience and we are constantly learning new skills. We get a better insight of the patient’s perspective during the entire span of their radiation treatment. For example most patients in unit 10 are required to have a full bladder and empty rectum. Having to hold their pee can be quite difficult for some patients, especially when there are delays, which pushes Unit 10 to be a very fast paced environment. Overall our first 4 weeks of clinical has been an exceptionally valuable experience and we’re looking forward to our next 4 weeks!


Until next time!

Jennifer and Ori


Michener Institute Series: Clinical Placement Site – Kingston Ontario


(Kingston City Hall)
It has been a month since the start of summer clinical placement, and I am currently
completing my placement in Kingston General Hospital (KGH) here at Kingston, Ontario.  Kingston is a nice beautiful town located at the north side of the entrance of outflow of St Lawrence River from Lake Ontario; it was the
first capital of Canada when Canada was still a province of British colony.
 
KGH host one of the most eastern cancer center in Ontario and it has a beautiful view because it is situated by the side of Lake Ontario, its front entrance open to the water. It is a perfect place for lunch and enjoys the sun during summer time.


      (KGH cancer centre front entrance)    
               
          (MacDonald
Park by water, in front of cancer centre)


The past month was phenomenal, words cannot fully describe the knowledge and experience we gain from clinical practice. The transition from purely academic to hands on
practice is eye-opening and a bit hectic; because each patient is unique and no knowledge from books can prepare you how to interact with all patients.  It is interesting to learn from the therapists, the way they educate patients on their first day of treatment, the type of approach to each patient base on the assessment they do during the conversation with them. It’s amazing how much compassion the therapists have for patients and how much they care for them.
 
 
During the first two weeks in CT simulation unit, I made my first mask and had my own mask made for treatment to head and neck regions. The mask is made of pliable plastics. They come in as a sheet of plastic in a frame, and are put into a warm/hot water bath for 2-4 minutes to makes it pliable, after the mask is taken out of the warm water bath there is a 30-60 seconds window before it hardens. The therapist takes out the mask, tower dry it as much as possible and covers it on patient’s head as fast as possible.  The therapists are very efficient at their job, but what is amazing are the patients going through the process; imagine a warm and moist piece of plastic cover you face, harden in an instant and lock your head into position, and afterword you cannot move for 5-10 minutes for CT scan. I never had thought of the discomfort till I experience it myself.


(My 1st  mask, can kinda see my face print)
 
So far the experience here is amazing, and hopefully the coming June will be equally fantastic as well.
 
Till next time.


Gordon