MiDATA – Enabling Medical Image Research at the University of Toronto

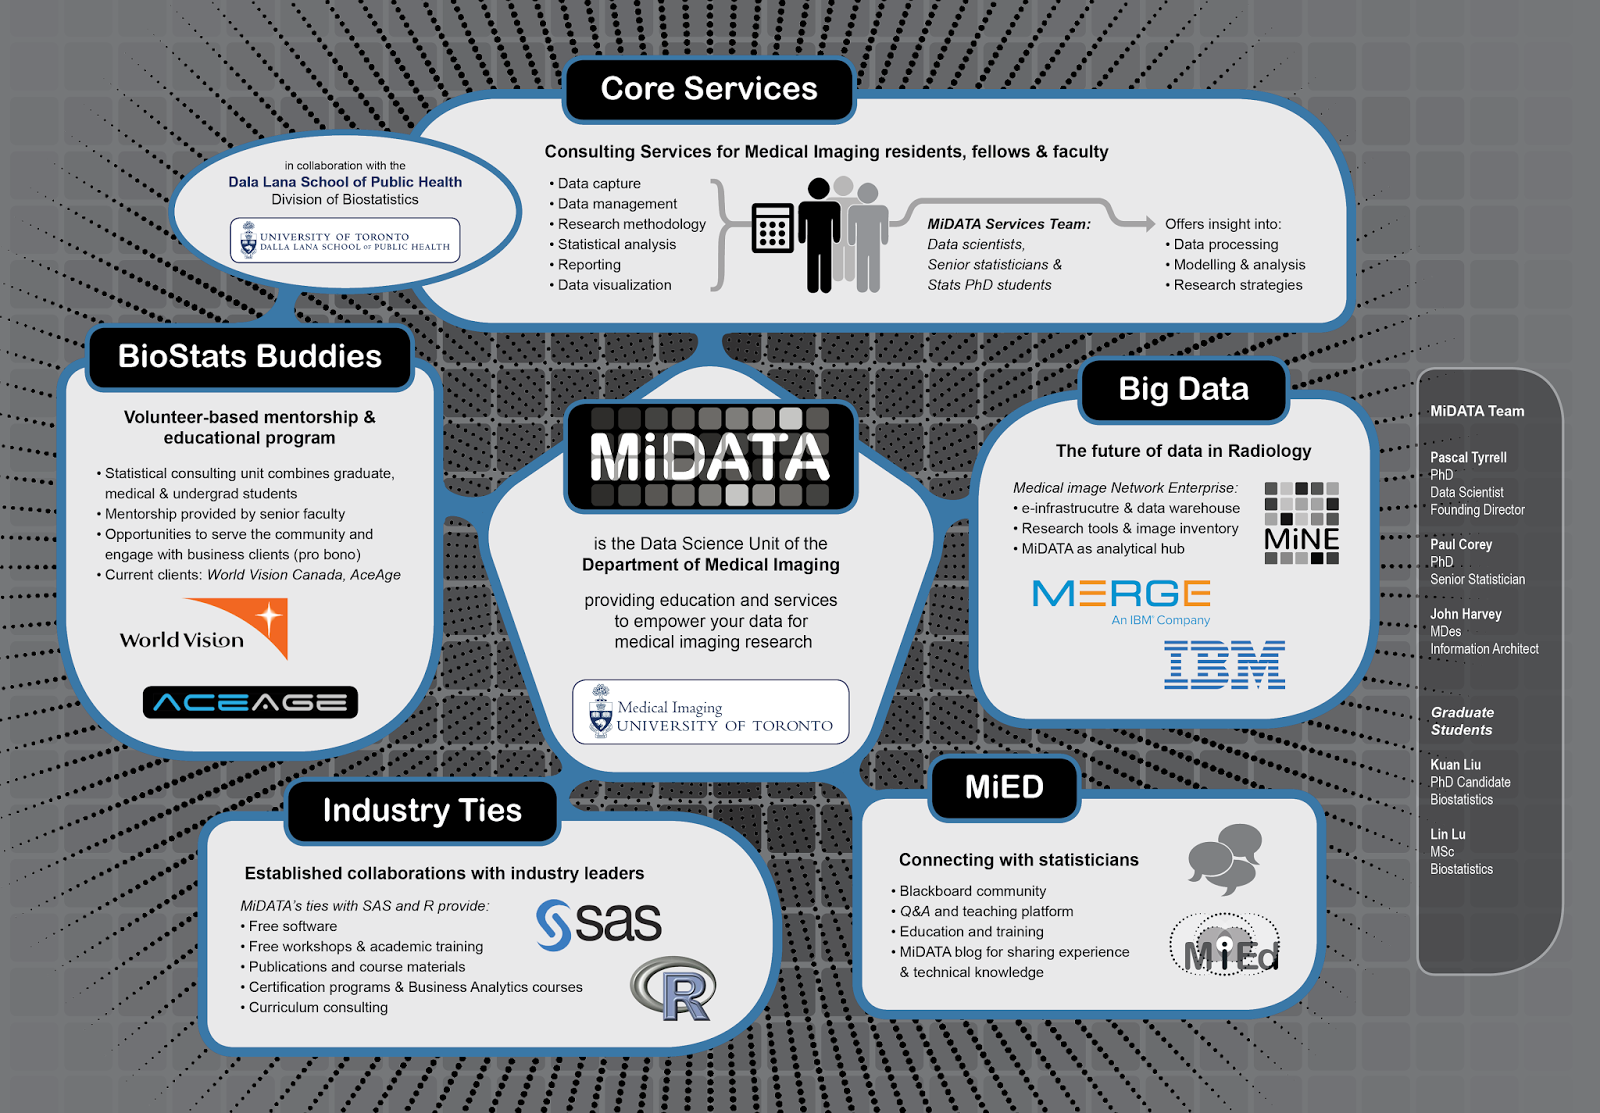
Poster to be presented at the Department of Medical Imaging Resident Achievement Day 2016

Where have a I been you ask? At my desk putting this program together! I apologize for being MIA for the past month or so but I it has been a busy time nurturing this fledgling program of MiNE (pun intended!).

Here is the premise:

Bridging the gap between clinical expertise and the science of managing and analyzing medical imaging data is challenging. To provide direction for data management as well as the analysis and reporting of research findings, we are in the process of introducing a data science unit – MiDATA – offering users an environment geared towards a “soup to nuts” approach to medical imaging research methodology and statistics. The Department of Medical Imaging of the University of Toronto is one of the largest in North America with a clinical faculty of more than 184 faculty, 60 residents and 80 fellows based at nationally and internationally renowned hospitals conducting cutting edge clinical research in the greater Toronto area. The challenge of any successful research and educational program is bridging the “know-do” gap. The goal of MiDATA is to facilitate impactful research through the efficient and creative use of a mentored learning environment.

Shout out to our collaborators the Division of Biostatistics from the Dalla Lana School of Public Health!


Tomorrow is the official unveiling at the 2016 Department of Medical Imaging Resident Achievement Day. I thought I would share with you our poster as a sneak peek…


Once you have digested its contents have a listen to Paper Planes by M.I.A. to decompress and…

… I’ll see you in the blogosphere (or at tomorrow’s event!)


Pascal Tyrrell


Dem Bones Dem Bones Dem Dry Bones

Happy Canadian Thanksgiving!!!

A traditional holiday – originating from the native peoples of the Americas – to celebrate the completion and bounty of the harvest.

This year I am off to Algonquin park for a canoe portage trip with the kids! I will take the time to appreciate some of the successes of our MiVIP program and this blog over the long weekend.

Thanks for being a part of it!

Listen to Dem Bones by the famous Delta Rhythm Boys

… and I’ll see you in the blogosphere.

Pascal Tyrrell

MiWord of the Day Is… Mesopotamia!

You are thinking about pursuing studies in medicine. You have enrolled in all the necessary courses at school to qualify you for the grueling application process and you are actively looking for volunteer opportunities. So why the need to be active in your community?


Today, I want to talk a little about the history of medicine. Around 3000 BC (and no I was not alive then if you are wondering) the middle east was a hotbed for civilizations who were in transition from being mainly nomadic to more settled. This “land between the rivers” – Mesopotamia – was ruled by many successive great kingdoms including the Akkadian, Babylonian, and Assyrian empires. Thanks to many archaeological and written remains we have discovered that healing practices indeed existed and were established during these times.


Mesopotamian medicine was predominantly religious and was delivered by a team of healers: the seers who would diagnose based on divination, the exorcists who would expel demons, and finally the physician priests who actually treated the sick mostly with charms, drugs, and some surgical procedures.  OK, so this intensely codified approach (which meant very little opportunity for discussion)  to healing that dominated the Mesopotamian kingdoms would not be able to adapt or improve much over time and would ultimately not contribute much to the Greek rational medicine that would come a later and evolve into today’s medicine. 


So why is it important? For two reasons:


Firstly, by understanding the history of medicine you will better appreciate the importance of your role as a physician in your community – regardless if you are a primary care physician on the front line or a radiologist who works in the back ground. What is important is to feel connected and part of your community.


Secondly, it is interesting to see that though Mesopotamian medicine recognized very early on that factors like cold, alcohol, and unhygienic conditions affected health, they were enable to advance and evolve their medicine as Ancient Greece did through ongoing experimentation and discussion. Moral of the story? Medical research rocks!


Do you remember the Babylon 5 series? It came many, many, many years later! Have a peek to decompress and…


… I’ll see you in the blogosphere.


Pascal Tyrrell


Who is your neighbor?

Classic Seth Rogan movie. Today we will be talking about good neighbors as a followup to my first post “What cluster Are You From?“. If you want to learn a little about bad neighbors watch the trailer to the movie Neighbors.


So let’s say you are working with a large amount of data that contains many, many variables of interest. In this situation you are most likely working with a multidimensional model. Multivariate analysis will help you make sense of multidimensional space and is simply defined as a situation when your analysis incorporates more than 1 dependent variable (AKA response or outcome variable). 


*** Stats jargon warning*** 
Mulitvariate analysis can include analysis of data covariance structures to better understand or reduce data dimensions (PCA, Factor Analysis, Correspondence Analysis) or the assignment of observations to groups using a unsupervised methodology (Cluster Analysis) or a supervised methodology (K Nearest Neighbor or K-NN). We will be talking about the later today.


*** Stats-reduced safe return here***
Classification is simply the assignment of previously unseen entities (objects such as records) to a class (or category) as accurately as possible.  In our case, you are fortunate to have a training set of entities or objects that have already been labelled or classified and so this methodology is termed “supervised”. Cluster analysis is unsupervised learning and we will talk more about this in a later post.


Let’s say for example you have made a list of all of your friends and labeled each one as “Super Cool”, “Cool”, or “Not cool”. How did you decide? You probably have a bunch of attributes or factors that you considered. If you have many, many attributes this process could be daunting. This is where k nearest neighbor or K-NN comes in. It considers the most similar other items in terms of their attributes, looks at their labels, and gives the unassigned object the majority vote!


This is how it basically works:


1- Defines similarity (or closeness) and then, for a given object, measures how similar are all the labelled objects from your training set. These become the neighbors who each get a vote.


2- Decides on how many neighbors get a vote. This is the k in k-NN.


3- Tallies the votes and voila – a new label! 


All of this is fun but will be made much easier using the k-NN algorithm and your trusty computer!


So, now you have an idea about supervised learning technique that will allow you to work with a multidimensional data set. Cool.


Listen to Frank Sinatra‘s The Girl Next Door to decompress and I’ll see you in the blogosphere…


Pascal Tyrrell

What Cluster Are You From?

This week and I had the pleasure of presenting to the Division of Rheumatology Research Rounds – University of Toronto. They were a fantastic audience who asked questions and appeared to be very engaged. Shout out to the Rheumatology gang!


So, I was asked to talk about a statistical methodology called Cluster Analysis. I thought I would start a short series on the topic for you guys. Don’t worry I will keep the stats to a minimum as I always do!


Complex information can always be best recognized as patterns. The first picture below on the left certainly helps you realize that it is not a simple task to know someone at a glance.


Now, I guess it doesn’t help that many of you have never met me either! However, you can appreciate that things get a little easier when the same portrait is presented in the usual manner – upright! 


This is an interesting example where the information is identical, however, our ability to intuitively recognize a pattern (me!) appears to be restricted to situations that we are familiar with.


This intuition often fails miserably when abstract magnitudes (numbers!) are involved. I am certain most of us can relate to that. 


The good news is that with the advent of crazy powerful personal computers we can benefit from complex and resource intensive mathematical procedures to help us make sense of large scary looking data sets.


So, when would you use this kind of methodology you ask? I’ll tell you…


1 – Detection of subgroups/ clusters of entities (ie: items, subjects, users…) within your data set.


2 – Discovery of useful, possibly unexpected, patterns in data.


OK, time for some homework. Try to think of times when you could apply this kind of analysis. 


I’ll start you off with an example that you can relate to. Every time you go to YouTube and search for your favorite movie trailer you get a long list of other items on the right that YouTube thinks may be of interest to you. How do you think they do that? By taking into account things like keywords, popularity, and user browser history (and many, many more variables) and using cluster analysis of course! You and your interests belong to a cluster. Cool!


In this series, we will delve into this fun world of working with patterns in data. 


Now that you have peace of mind, listen to The Grapes of Wrath


See you in the blogosphere,


Pascal Tyrrell


Another successful diagnosis thanks to the x-ray…

For more info see Free Birds

Happy Canadian Thanksgiving!!!

A traditional holiday – originating from the native peoples of the Americas – to celebrate the completion and bounty of the harvest. Well, no harvest for me but I will take the time to appreciate some of the successes of our MiVIP program and this blog over the long weekend.


Thanks for being a part of it!


See you in the blogosphere,

Pascal Tyrrell

Starting a new research project? Think Zorro!

Well, OK maybe think Zotero. The Mask of Zorro was such a great movie I could not resist. Having said that, when starting a new research project it may be helpful for you to think of yourself as Zorro. It may give you that extra zip required to get you through the inevitable research project doldrums…


So what is this Zotero thing anyway? Well Zotero is an open source reference management software that can act as your personal research assistant – helping you to organize and cite the numerous articles that you will be reviewing.


I was talking to Ori the other day – who is in the Radiation Therapy program at the Michener Institute – and he is in the process of planning a research project. As it turns out he has been a member of the MiVIP family since the beginning so he is well aware of my earlier posts that will help him along:


1- Thoughts on how to become a researcher


2- What is in a research question?


3- What makes up a good research question with the F.I.N.E.R. series.


Now how about the reference management software thing? Well, I give you an easy, fun, and instructional e-learning module to help you along. Our group has just finished our first kick at the can (so to speak) and so I invite you to have a look. Here is the link:


MiEducation Zotero e-learning module


Tell us what you think by posting comments and suggestions to this post.


Maybe listen to Ylvis in What Does the Zorro Say? while you go through the module. Fox in spanish is zorro…

 
… and I’ll see you in the blogosphere.
 
 
Pascal Tyrrell


Face Validity: Who’s Face Is It Anyway?

Yes, I was a big fan of the A-Team. Who wasn’t? Mr. T (I guess that makes me Prof. T…) was always entertaining to watch. Lieutenant Templeton Arthur Peck was suave, smooth-talking, and hugely successful with women. Peck served as the team’s con man and scrounger, able to get his hands on just about anything they needed. Need a refresher? Have a peek here.


Well in a past post 2 Legit 2 Quit we talked about why we assess validity – because we want to know the nature of what is being measured and the relationship of that measure to its scientific aim or purpose. So what if we are uncertain that our measure (a scale for example) looks reasonable? We would consider face validity and content validity. Essentially, face validity assess whether or not the instrument we are using to measure appears to be assessing the desired qualities or attributes based on “the face of it”. Content validity – that was touched on in the previous post – is closely related and considers whether the instrument samples all of the relevant or important content or interest.


So, why the importance of face validity? Whenever you need to interact successfully with study participants there is often a need to:


– increase motivation and cooperation from participants for better responses.
– attract as many potential candidates.
– reduce dissatisfaction among users.
– make your results more generalizable and appealing to stake holders.


These are especially important points to consider when planning a study that involves human subjects as respondents or there exists any level of subjectivity in how data is collected for the variables of interest in your study. 


However, you want to avoid a “Con Man” situation in your study where respondents’ answers are not what they appear to be. As a researcher you need to be aware that there may be situations where Face Validity may not be achievable. Let’s say for instance you are interested in discovering all factors related to bullying in high school. If you were to ask the question ‘ have you ever bullied a classmate into given you his/her lunch money?’ you may have Face Validity but you may not get an honest response! In this case, you may consider a question that does not have face validity but will elicit the wanted answer. Ultimately, the decision on whether or not to have face validity – where the meaning and relevance are self-evident – depends on the nature and purpose of the instrument. Prepare to be flexible in your methodology!


Remember that face validity pertains to how your study participants perceive your test. They should be the yard stick by which you assess whether you have face validity or not.


Listen to Ed Sheeran – The A Team to decompress and…


… I’ll see you in the blogosphere.


Pascal Tyrrell

You like potato and I like potahto… Let’s Call the Whole Thing Off!

We have been talking about agreement lately (not sure what I am talking about? See the start of the series here) and we covered many terms that seem similar. Help!


Before you call the whole thing off and start dancing on roller skates like Fred Astaire and Ginger Roberts did in Shall We Dance, let’s clarify a little the difference between agreement and reliability. 


When assessing agreement in medical research, we are often interested in one of three things:


1- comparing methods – à la Bland and Altman style.


2- validating an assay or analytical method.


3- assessing bioequivalence.


Agreement represents the degree of closeness between readings. We get that. Now reliability on the other hand actually assesses the degree of differentiation between subjects – so one’s ability to tell subjects apart from within a population. Yes, I realize this is a subtlety just as Ella Fitzgerald and Louis Armstrong sing about in the original Let’s Call the Whole Thing Off.


Now, often when assessing agreement one will use an unscaled index (ie a continuous measure for which you calculate the Mean Squared Deviation, Repeatability Standard Deviation, Reproducibility Standard Deviation, or the Bland and Altman Limits of Agreement) whereas when assessing reliability one often uses a scaled index (ie a measure for which you can calculate the Intraclass Correlation Coefficient or Concordance Correlation Coefficient). This is because a scaled index mostly depends on between-subject variability and, therefore, allows for the differentiation of subjects from a population. 


Ok – clear as mud. Here are some very basic guidelines:


1- Use descriptive stats to start with.


2- Follow it up with an unscaled index measure like the MSD or LOI which deal with absolute values (like the difference).


3- Finish up with a scaled index measure that will yield a standardized value between -1 and +1 (like the ICC or CCC).


Potato, Potahtoe. Whatever. 


Entertain yourself with this humorous clib from the Secret Policeman’s Ball and I’ll…

See you in the blogosphere!


Pascal Tyrrell

2 Legit 2 Quit

MC Hammer. Now those were interesting pants! Heard of the slang expression “Seems legit”? Well “legit” (short for legitimate) was popularized my MC Hammer’s song 2 Legit 2 Quit. I had blocked the memories of that video for many years. Painful – and no I never owned a pair of Hammer pants!


Whenever you sarcastically say “seems legit” you are suggesting that you question the validity of the finding. We have been talking about agreement lately and we have covered precision (see Repeat After Me), accuracy (see Men in Tights), and reliability (see Mr Reliable). Today let’s cover validity.


So, we have talked about how reliable a measure is under different circumstances and this helps us gauge its usefulness. However, do we know if what we are measuring is what we think it is. In other words, is it valid? Now reliability places an upper limit on validity – the higher the reliability, the higher the maximum possible validity. So random error will affect validity by reducing reliability whereas systematic error can directly affect validity – if there is a systematic shift of the new measurement from the reference or construct. When assessing validity we are interested in the proportion of the observed variance that reflects variance in the construct that the method was intended to measure.


***Too much stats alert*** Take a break and listen to Ice, Ice, Baby from the same era as MC Hammer and when you come back we will finish up with validity. Pants seem similar – agree? 🙂


OK, we’re back. The most challenging aspect of assessing validity is the terminology. There are several different types of validity dependent of the type of reference standard you decide to use (details to follow in later posts):


1- Content:  the extent to which the measurement method assesses all the important content.


2- Construct: when measuring a hypothetical construct that may not be readily
observed.


3- Convergent: new measurement is correlated with other measurements of the same construct.


4- Discriminant: new measurement is not correlated with unrelated constructs.

So why do we assess validity? because we want to know the nature of what is being measured and the relationship of that measure to its scientific aim or purpose.


I’ll leave you with another “seem legit” picture that my kids would appreciate…


See you in the blogosphere,


Pascal Tyrrell