The Ram-ifications of Risk


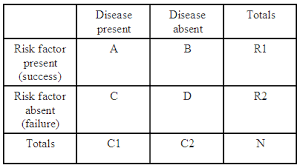
In the final installment of this series, I want to discuss how we can use the Ratios of Risk in a clinical context. To recap, we previously discussed an absolute measure of risk difference (appropriately called the risk difference or RD), as well as a relative measure of risk difference (relative risk or RR). 

To see how we can apply these risks, let’s tweak our original example. Let’s assume that smartphone thumb could potentially lead to loss of thumb function (not really, don’t worry!). Let’s also suppose that surgery is a possible treatment for smartphone thumb, and the following results were obtained after a trial.


Surgery
No Surgery (control)
Totals
Retained 
thumb function
7
6
13
Lost thumb function
3
4
7
Totals
10
10
20


The big question is: how good an option is surgery?
Let’s calculate the RD (note that the “risk” here is of losing thumb function): 4/10 – 3/10= 0.1

In other words, there is a 10% greater risk of loosing thumb function if you did not have the surgery. Based on this information alone (or by calculating the RR and OR), we might be quick to conclude that surgery is a great intervention.

But before we do that, let’s calculate another statistic, which will prove to be very useful: it’s called the number needed to treat (or NNT), and is given by 1/RD. The NNT is the number of patients that must be treated for 1 additional patient to derive some benefit (retain an intact and functioning thumb). In our case, NNT = 1/0.1 = 10. So, in order save 1 patient from loosing his thumb, another 9 will have had to undergo surgery with no apparent benefit. As you can see, the NNT sheds a very humbling light on our intervention. The ideal NNT is equal to 1. Beyond that, we must keep in mind that the additional patients undergoing the treatment have been exposed to all the negative side effects, without the intended benefit.

Throughout this series we discussed the meaning of risk, how it can be used for comparison (the various ratios of risk), and finally its application in a clinical setting (the ramifications of risk). After all these posts, smartphone thumb may have started to seem like a very real threat. But I think you should be fine…. as long as you know the risks!


So what’s up with the Dodge Ram ad (I am actually a F150 guy myself)? Well I just thought it went well with ramifications of risk. Cheesy I know. But who knows maybe it will help you to remember…


See you in the blogosphere,


Indranil Balki and Pascal Tyrrell

The Ratios of Risk With a Zip!

With summer here, I think it’s time that we continued our discussion on risk. No, I’m not talking about the dangers of your favourite adventure sport… but then I just got back from a trip to Costa Rica as part of the Canadian delegation for the Gateway to Trade  project and I, of course, went ziplining! Awesome. 


It’s been a few months so I recommend catching up on Risky Business – Is it all Relative? and Happy New Year and Enjoy some AR&R


Before we get started I want to introduce a student of mine, Indranil Balki, who has agreed to come aboard and help me write this blog. Life is busy for me and I feel bad that I can’t post as much as I would like. So look to find Indranil signing off with me at the bottom of these posts.

When we last left off, we were interested in the idea of comparing risks – how many times more likely is it for a smartphone user to develop smartphone thumb than for a non-smartphone user?


We touched on one way to compare the two groups in the last post, by finding the risk difference A/(A+B) – C/(C+D). But to answer our question, we need a ratio. It turns out that this is called (helpfully) a risk ratio, or relative risk (RR). The RR is given by A/(A+B) divided by C/(C+D). A RR basically compares the risk in the exposed (smartphone owners) and unexposed conditions. 


For example, let’s say that 20% of smartphone users developed smartphone thumb and 10% of non-smartphone users developed smartphone thump. Then the RR is 2, meaning that you are twice as likely to get the disease if you own a smartphone than if you don’t.


Well wasn’t that an elegant way to compare the risks between two groups? As you might have guessed, a RR of 1 shows no difference in risk between the groups, and an RR > 2 or <0.5 is usually considered statistically significant.


So let’s say you meet a friend at school and he finally reveals that he has smartphone thumb (don’t worry, it’s not contagious – I think!). Since you’ve been following this blog, you immediately wonder, what’s the probability that he has a smartphone? To answer this reverse question, it turns out that you technically need what is called an odds ratio (OR). The OR is comparable to the RR if the prevalence of the disease is low. But it is a slightly different way to compare risks.


Given that you have smartphone thumb, the odds that you had the exposure are given by the probability that you had a smartphone (A/A+C), divided by the probably that you didn’t have it (C/A+C). This simplifies to A/C. Similarly, the odds of exposure in those without smartphone thumb is B/D. The odds ratio then, is calculated by dividing these 2 odds. OR = A/C ÷ B/D. An OR of, say 3, tells us that there’s a 3 times higher chance your friend has a smartphone than he doesn’t.


Well, that might have been a tough post! Take some time to think about it, have a gander at some ziplining in Costa Rica here and don’t spend too much time on your smartphone…


See you in the blogosphere,


Indranil Balki and Pascal Tyrrell


Happy New Year and Enjoy Some AR&R…

Or Attributable Risk Reduction…

First let me wish you all a fantastic New Year! Last year was crazy and I think this year is looking like it will be more of the same…


So in a previous post called Risky Business: Is It All Relative? we started talking about risk. We agreed that in lay terms a risk is generally associated with a bad event. However, a risk in statistical terms refers simply to the probability (usually statistical probability value between 0 and 1) that an event will occur, whether it be a good or a bad event.


We also defined the risk of “smartphone thumb” as the number of new cases of smartphone thumb (the outcome) in a given period of time divided by the total number of people who own a smartphone (the exposure) and are at risk. This was called the cumulative incidence or absolute risk. Now what if we wanted to compare this risk to people who did not receive a smartphone for their birthday or Christmas for that matter? Let’s look at the results in a contingency table:


So, the absolute risk of smartphone thumb is A/(A+B) and similarly for those sad people without a smartphone their risk is C/(C+D). Now your chances of developing smartphone thumb are not necessarily 0 as maybe you are an avid gamer and play a little too much Xbox on the weekends. The reduction in risk can be expressed as the risk difference (also called the attributable risk reduction – ARR) and can be calculated as RD = A/(A+B) – C/(C+D). We can also estimate the proportion of cases of smartphone thumb among smartphone users that can be attributed to smartphone use by calculating the attributable risk percent: [RD/ A/(A+B)] x 100.


Let’s say 20% of smartphone users develop smartphone thumb whereas only 10% or non-smartphone users do. The RD is then equal to 10% (0.2 – 0.1 *100). The reduction in the chances of experiencing smartphone thumb who own a smartphone is the AR% which in this case is 50% (0.1/0.2*100).

That was easy. What’s next? Well, what if we want to know how many times more likely is it for a smartphone user to develop smartphone thumb than for a non-smartphone user? Let’s talk about that next post.


For now, decompress listening to “Under my Thumb” by the Rolling Stones. Classic…


See you in the blogosphere,


Pascal Tyrrell

Risky Business: Is It All Relative?

Now this movie takes me back a few years. Tom Cruise’s first big movie Risky Business. His underwear dance scene is pretty famous (haven’t scene it yet? Have a gander here). 


So what does Tom Cruise in underwear have anything to do with our blog? Well it is the concept of risk that interests me today. David Streiner was a fantastic professor of mine and is the author of many great stats publications. He talks about risk here. I will endeavor to do the topic justice with his help over the next few posts.


What do we mean when we talk about risk? In lay terms a risk is generally associated with a bad event. However, a risk in statistical terms refers simply to the probability (usually statistical probability value between 0 and 1) that an event will occur, whether it be a good or a bad event. 


Now that you are clear on that, you are probably wondering what are the best ways of describing risk or – better yet – comparing estimates or risk between groups (wondering what a statistical estimate is? See my earlier post here).  


Let’s say that you have just received the latest and greatest smartphone for your birthday and you can’t wait to text everyone you know to tell them about it. This would be considered the exposure: your smartphone. The outcome would be “smartphone thumb”: a painful thumb resulting from smartphone overuse (don’t believe me? See here). We can define the risk of smartphone thumb as the number of new cases of smartphone thumb (the outcome) in a given period of time divided by the total number of people who own a smartphone (the exposure) and are at risk. This is also called the cumulative incidence or absolute risk


As you have an inquisitive mind, you are now wondering what would be the difference in levels between conditions: people with a smartphone compared to people without. Well this can be expressed as absolute differences in risk or relative changes in risk and I will have mercy and address this in more detail… next post! 


For now, decompress by listening to the Barenaked Ladies singing Pinch me (believe it or not this song has something in common with Tom Cruise from Risky Business. Get it yet?).


See you in the blogosphere,


Pascal Tyrrell

Causality, Analogy and… Twins?!!!

What a great movie from the eighties. One always thinks of twins as identical or monozygotic. But twins can be dizygotic or fraternal meaning that they develop from two separate eggs and share the same womb. In this case they are more analogous than anything else – as in the movie Twins with Arni and Danny (see the trailer here for a refresher).

In my most recent set of posts I have been talking about Bradford Hill’s criteria for causality – also know as cause and effect (see here for first post). So far we have covered strength, consistency, specificity, temporality, dose-response, plausibility, coherence, and experiment. Today we are going to talk about analogy – the ninth and final criterion.

Again it is an easy one today. Perfect for a Friday. When considering an association for causality one can look for similar relationships and essentially judge by analogy. If causality was shown in similar or analogous evidence to the relationship you’re interested in then this would support your hypothesis. With the effects of acetaminophen (Tylenol) on pain clear to us we would surely be ready to accept similar evidence with another analgesic drug in pain relief.


Bradford Hill’s criteria wrap-up:

 
None of the nine criteria can bring indisputable evidence for or against your hypothesis of causality and none can be absolutely required. What they can do, with greater or less strength, is to help you decide – is there any other way of explaining the relationship of interest than cause and effect?


That’s it! All nine criteria. Now it’s time to try and apply them to a real life example. Let me know how it goes.
 
 
Have a listen to “Ready to Start” by Arcade Fire and…
 
… I’ll see you in the blogosphere.
 
 
Pascal Tyrrell

Prison Experiments and Causality? Whoops!

Guard or inmate? Who would you like to be?

In my most recent set of posts I have been talking about Bradford Hill’s criteria for causality (see here for first post). So far we have covered strength, consistency, specificity, temporality, dose-response, plausibility, and coherence. Today we are going to talk about experiment – the eighth criterion. 


This is an easy one (and it’s a Friday… Perfect!). Can the condition of the association of interest be altered (prevented or ameliorated) by an appropriate experimental / semi-experimental regimen? If so, then this would lend support to the notion of causality. 


That’s it. Now consider the infamous Stanford Prison Experiment that has etched its place in history, as a notorious example of the unexpected effects that can occur when psychological experiments into human nature are performed.The experiment was a study of the psychological effects of becoming a prisoner or prison guard. The experiment was conducted at Stanford University on August 14–20, 1971, by a team of researchers led by psychology professor Philip Zimbardo using college students. Needless to say the experiment got out of hand and participants were harmed in the research process. Whoops! Not good.


The Stanford Prison Experiment led to the implementation of rules to preclude any harmful treatment of participants. Before they’re implemented, human studies must now undergo an extensive review by an research ethics board or institutional review board.


You may be able to show causality by an experimental regimen but at what cost? Be careful and think about research ethics before you leap into an experiment.


Watch the trailer to the movie about the Stanford Prison Experiment to get a better idea of what I am talking about and…


… I’ll see you in the blogosphere!


Pascal Tyrrell

Coherence, Causality… and Space – Time?

Warp speed ahead!

In my most recent set of posts I have been talking about Bradford Hill’s criteria for causality (see here for first post). So far we have covered strengthconsistencyspecificitytemporality, dose-response, and plausibility. Today we are going to talk about Coherence – the seventh criterion. 


The association should be compatible with existing theory and knowledge.  In other words, it is necessary to evaluate claims of causality within the context of the current state of knowledge. What concessions do we have to make in order to accept a particular claim of causality? Too much, too little, or just right?


As with the issue of plausibility, research that disagrees with established theory and knowledge are not automatically false.  They may, in fact, force a reconsideration of accepted beliefs and principles.

In his Special Theory of Relativity, Einstein states two postulates:


1- The speed of light (about 300,000,000 meters per second) is the same for all observers, whether or not they’re moving.


2- Anyone moving at a constant speed should observe the same physical laws.


Putting these two ideas together, Einstein realized that space and time are relative — an object in motion actually experiences time at a slower rate than one at rest. Although this may seem absurd to us, we travel incredibly slow when compared to the speed of light, so we don’t notice the hands on our watches ticking slower when we’re running or traveling on an airplane. Scientists have actually proved this phenomenon by sending atomic clocks up with high-speed rocket ships. They returned to Earth slightly behind the clocks on the ground. 


Not convinced? Watch Einstein’s Time is an Illusion for addtitional insight.


Still not convinced? That’s OK. Often fundamental changes to basic concepts of a scientific discipline take time for people to understand and adopt as a belief. This is referred to a paradigm shift


Bottom line is that the cause-and-effect interpretation of your data should not seriously conflict with the generally known facts of the base of knowledge in your field of study – but there is wiggle room here!


Watch the movie trailer for Coherence to confuse you even more and…


… I’ll see you in the blogosphere.


Pascal Tyrrell

Plausibility, My Dear Watson!

Or was that “Elementary, my dear Watson”? I always get those confused…


Anyway, in my most recent set of posts I have been talking about Bradford Hill’s criteria for causality (see here for first post). So far we have covered strength, consistency, specificity, temporality, and dose-response. Today we are going to talk about plausibility – the sixth criterion. An easy one at that.


For plausibility to exist we need the association of interest to agree with currently accepted understanding of pathological/ biological/ physical processes. In other words, there needs to be some theoretical basis for the association we are considering. While we hope to avoid spurious associations, at the same time, relationships that disagree with current understanding is not necessarily false; they may, in fact, be a needed challenge to accepted beliefs and principles.


 As Sherlock Holmes advised Dr. Watson, ‘when you have eliminated the impossible, whatever remains, however improbable, must be the truth.’


Next time we will talk about the 7th of nine criteria: coherence.


Don’t remember who Sherlock Holmes is? See the trailer to Robert Downey‘s rendition of Sir Arthur Conan Doyle‘s famous detective here and…


… I’ll see you in the blogosphere,


Pascal Tyrrell


A Spoonful of Sugar… Makes the Dose-Response Go Around?

An oldie but a goodie! Haven’t heard of Mary Poppins or her spoonful of sugar? Have a peek here for your dose of the classics. In my most recent set of posts I have been talking about Bradford Hill’s criteria for causality. So far we have covered strength, consistency, specificity, and temporality. Today we are going to talk about biologic gradient or dose-response.


This criterion is pretty easy to understand. An increasing amount of exposure increases a risk in question and with a dose-response relationship present, it is strong evidence for a causal relationship!  


Let’s say you think that being out in the sun in a bathing suit causes your skin to suffer a sunburn. So, the exposure is sunlight and the outcome is sunburn. Based on everyone’s experience, it would certainly appear that the longer you stay out in the sun the greater the risk you will suffer a burn! Your parents have been warning you of this for ever.


However, as with specificity, the absence of a dose-response relationship does not rule out a causal relationship.  A threshold may exist above which a causal relationship is present.  


Next time we will talk about the 6th criterion: plausibility.


Watch one of Simon’s Cat earlier clips Cat-Man-Do and see if you can spot the dose-response…


… and I’ll see you in the blogosphere.


Pascal Tyrrell


Just in the Nick of Time… Causality.

Now that was a great movie: Interstellar. See the trailer here for a refresher. So this movie talked a lot about worm holes – essentially an area of warped spacetime. Theoretically a worm hole could allow time travel. Want to know more? Grab a large coffee and see here. You may be thinking what all this has to do with medical imaging but, believe it or not, I posted about x-rays in space earlier in the blog (see here).

Listen to Hans Zimmer’s – Time from the movie Inception (another great movie) to get into the mood.

Now, we have been talking about Bradford Hill’s criteria for causality and today we are addressing the fourth one: temporality. The exposure of your association of interest should always precede in time the outcome.  If factor “A” is believed to cause a disease,  then factor “A” must necessarily always precede the occurrence of the disease. So for example the act of smoking (or being exposed to second-hand smoke) must precede the development of lung cancer for the relationship to be considered causal. This is the only absolutely essential criterion (out of nine).

Easy one, right? Next time I will be talking about biological gradient.


I am not sure you need time to decompress today as it has not been too taxing… but listen to Bonnie Raitt Nick of Time anyway…

… and I’ll see you in the blogosphere.

Pascal Tyrrell