What happens when you put a famous pop superstar with various Billboard number one hit singles as an endorser for a medical field involving teeth, mouth and gum surgeries?
A Katy Perry-odontist!
And no, I am not insinuating the likelihood of Ms. Perry giving up her “Hard Candy” tour and making her way down to Harvard Med for a doctor of dental surgery specializing in periodontistry, but in reality, when researching, there are a lot of weird combinations of research that actually lead to a plausible conclusion!
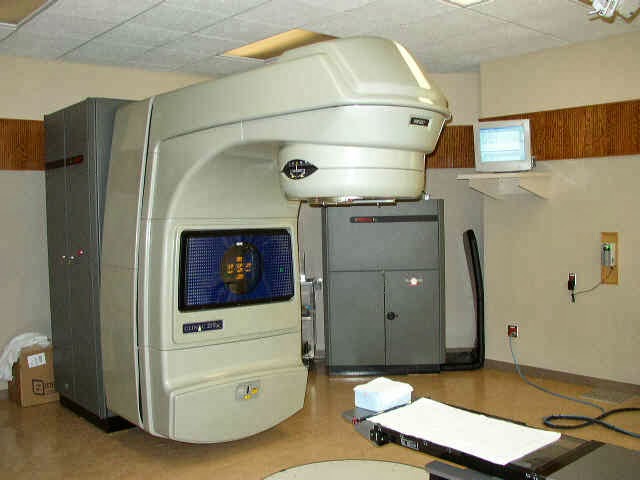
Take cost effectiveness of MRIs, CT scans and ultrasounds. There are many variables pertaining to which machine is more cost effective, but in order to find that out, the research being done with regards to the cost involves stepping OUTSIDE THE BOX and figuring out unique key factors that all contribute to the cost, timing, and effectiveness. One must observe not only the actual cost of the machine, but also the condition the patient is in and the situation of the effected area. In order to look at that, maybe some family history must be dug up. And there you go! A whole research perspective on family history of certain patients, just to figure out cost effectiveness of a certain machine. Weird combination of research if you think about it, but in the end, very effective in reaching somewhat of a conclusion to the research question, just like the medical imaging equipment should be doing in the first place! Do not underestimate the lengths in research it takes to solve the question at hand, and always think outside the box, because you never know what you will find, and someday, maybe Katy Perry will open up her own clinic, and sooth patients with her very own soundtrack!
Keep Researching and Singing,
Faith Balshin
Don’t forget to check out MiVIP’s twitter account, @MiVIP_UofT!
Comment on what you think are weird research combinations if you dare!