My name is Jenny Du, and I have just wrapped up my ROP299 project in the Tyrrell Lab, as well as my second year at the University of Toronto, pursuing a bioinformatics specialist. Looking back, it was a bumpy ride, but in the end, this journey was very rewarding and has taught me a lot of things on both machine learning topics as well as the process of scientific research.
Like most of the other ROP299 students, I had no experience with machine learning and neural networks. Despite doing some research beforehand, I found myself googling what everyone was talking about during the weekly meetings (thankfully, they were online) to make sure I was not completely lost. None of my first-year courses had prepared me for these kinds of things! And so, with some uncertainties in my heart, I started my ROP journey.
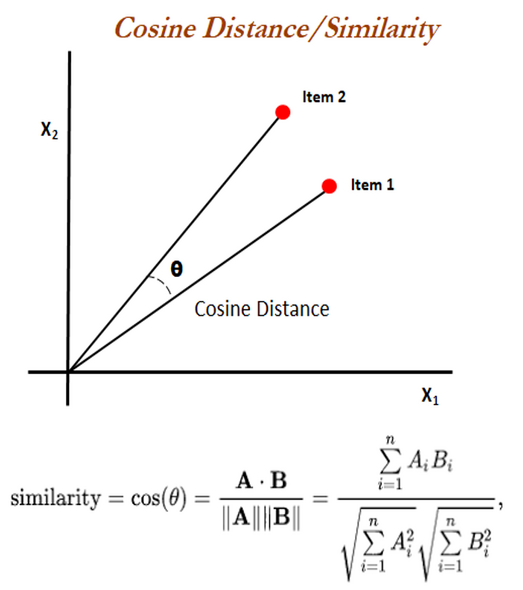
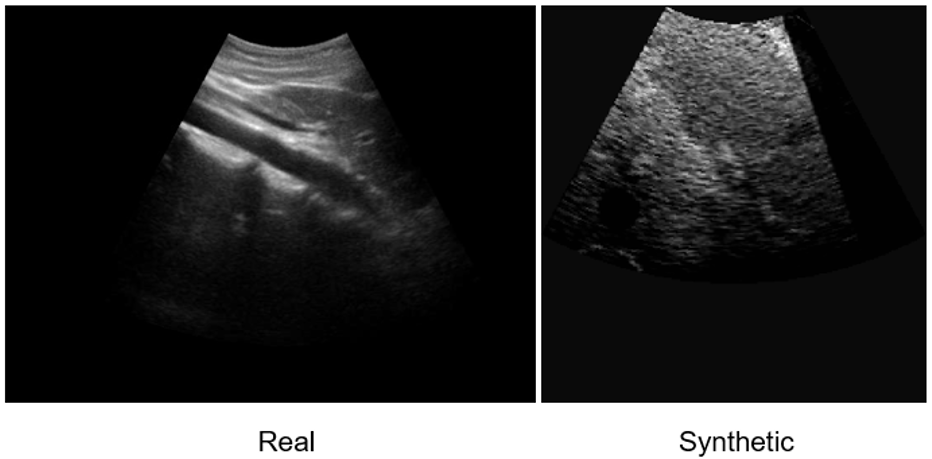
I decided on my overall research topic fairly early, but the details were adjusted several times as I progressed through my project. My project is about coming up with a way to quantitatively assess a set of synthetic ultrasound images in terms of how “realistic” they look compared to the real ultrasound images. “Realism” here is defined as whether the synthetic images can be used as training images in replacement of the real images without creating too big of an impact on the machine learning algorithm. At first, I came up with a naïve proposal: I will build an algorithm that differentiates real and synthetic ultrasound images, and if the algorithm can classify the two kinds (with high accuracies), then it means that the synthetic images are not realistic, and vice versa. In the weekly meeting, Dr. Tyrrell immediately pointed out why this wouldn’t work. In my proposal, a low accuracy could mean that the synthetic and the real images are very similar, but it could also mean that the algorithm itself is terrible. For example, if my algorithm has 50% accuracy, then it is basically randomly guessing each image, like a coin toss, so its classification is unreliable, to say the least. He suggested that I look online to see how others have done it. There was very little information that directly relates to what I’m doing, but eventually I was able to come up with a plan to extract features from the images using a pre-trained CNN model and measure the cosine similarity score between two images and graph these values into a histogram to see their distribution. Dr. Tyrrell also suggested that I compare the distributions at different equivalence margins to determine how big a mean difference is acceptable.
Thankfully, I was able to find some code online that I was able to use in my project with minor changes, and I was able to produce some distribution data fairly quickly. Then, I encountered what I considered to be the hardest part of my entire project: to statistically interpret and discuss my data and create a conclusion out of it. Since I am not a statistics student, and so my knowledge of statistics is limited to one stats course I took as a part of my program requirements. It took a while for me to learn all these statistical concepts and understand why each is needed in my project.
This year was especially interesting since everything was online. Despite not being able to see each other face-to-face, I was still able to receive much support from Dr. Tyrrell and other students in the lab. Mauro was very helpful in preparing the datasets for my project as well as answering any problems related to the codes. Guan also helped to check my statistical calculations and clarifying some hard concepts. I have also made great friends with the other ROP students this year, and hopefully we will be able to see each other in person when the school re-opens.
Overall, this journey was a wonderful experience, and I have learned many things from it. Not only did I got some familiarity with machine learning topics and their application in medicine, but I have also gained experience in the general academic research process, from coming up with a topic to the actual implementation to the final reports. There were challenges along the way, but in the end, it was very rewarding. I am extremely thankful to Dr. Tyrrell for the guidance and support and am grateful for this opportunity.
Jenny Du