Linxi Chen’s STA399 Journey

Hi everyone! My name is Linxi Chen and I’m finishing my third year at the University of Toronto, pursuing a statistics specialist and a mathematics major. I did an STA399 research opportunity program with Professor Pascal Tyrrell from May 2021 – August 2021 and I am very grateful that I can have this opportunity. This project provided me an opportunity in understanding machine learning and scientific research. I would love to share my experience with you all.

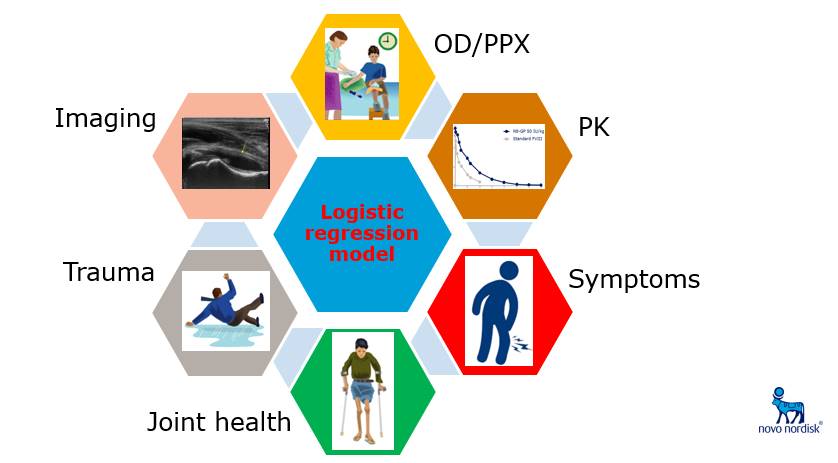
Initially, I had no experience with machine learning and convolutional neural network and integrating machine learning with medical imaging was a brand-new area for me. Therefore, at the beginning of this project, I searched loads of information on machine learning to gain a general picture of this area. The first assignment in this project was to make a slide deck on machine learning in medical imaging. Extracting and simplifying the gathered information helped me understand this area more deeply. 

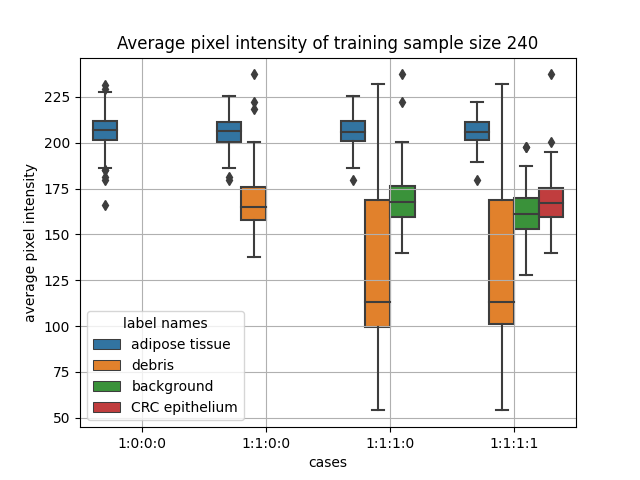
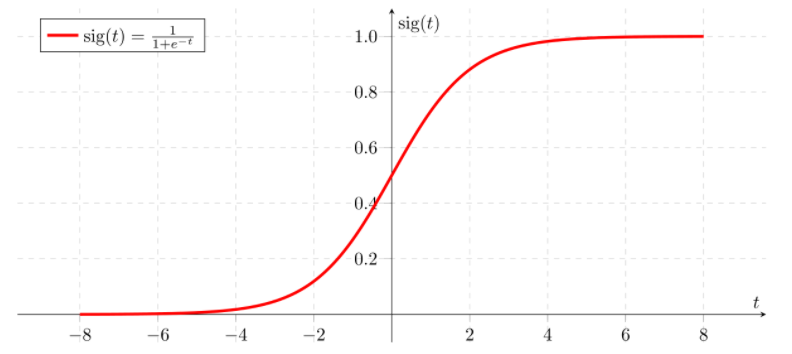
My research project is to find out an objective metric for heterogeneity and explore how dataset heterogeneity will affect heterogeneity as measured by the CNN training image features with sample size. At first, how to specifically define the term “heterogeneity” was a big challenge for me, since there are various kinds of definitions on Google and there was so little information that was directly related to my project. By comparing the information on websites and talking with Professor Tyrrell in the weekly meeting, I managed to define the term “between-group heterogeneity” as the extent to which the measurements of each group vary within a dataset, considering the mean of each subgroup and the grand mean of the population. Next, designing the experiment setup was also challenging, because I have to ensure the experiment steps are applicable and explicable. The datasets were separated into different groups according to the label of each image. We introduced new groups into the dataset while keeping the total sample size the same in each case. There was a total of four cases and the between-group heterogeneity was measured using Cochran’s Q which is a test statistic based on chi-squared distribution. The experiment setup was modified several times, because problems came up from time to time. For example, I planned to use multi-classification CNN model at first, but it showed that I have to use different number of output neurons for the model in different cases, which made the results not comparable. Professor Tyrrell and Mauro suggested I use a binary-classification model with pseudo label, which successfully solved this problem. Luckily, I found some code on the website and with the help of Mauro, I managed to come up with the code that was applicable to use. Next came the hardest part that I encountered. Although idealistically my expectation could be explained very well, still the output results I got were not what I expected. After modifying the model and the sample size several times, I finally managed to get the expected results.

Overall, I have learned a lot from this ROP program. With the guidance of Professor Tyrrell and the help of students in the lab, I have gained an in-depth understanding of machine learning, neural network and the process of scientific research. Also, I have become more familiar with writing a formal scientific research paper. The most valuable thing that I got from this experience is the ability of problem-solving and never be frustrated when things get wrong. I would like to thank Professor Tyrrell for giving me this opportunity to learn about scientific research and helping me overcome all the challenges that I encountered during this process. I’m very grateful that I have gained so many valuable skills in this project. Also, I would like to thank Mauro and all the members in the lab for giving me so much help with my project.

Linxi Chen

MiWORD of the Day Is… Heterogeneity!

Today we are going to talk about the variation within a dataset, which is different from the term “pure variance” that we commonly use. So, what exactly is heterogeneity? 

There are three different kinds of data heterogeneity within the dataset: clinical heterogeneity, methodological heterogeneity, and statistical heterogeneity. Inevitably, the observed individuals in a dataset will differ from each other, which from the perspective of medical imaging, a set of images might be different from the average pixel intensities, RGB values, border on the images, and so on. Therefore, any kind of variability within the dataset is likely to be termed heterogeneity. 

However, there are some differences between variance and heterogeneity. If a population has lots of variance, it only means that there are a lot of differences between the grand mean of the population and the individuals. Variance is a measure of dispersion, meaning how far a set of numbers is spread out from their average value. However, with respect to data heterogeneity, it means that there are several subpopulations in a dataset, and these subpopulations are disparate from each other. Therefore, we consider the between-group heterogeneity which represents the extent to which the measurements of each group vary within a dataset, considering the mean of each subgroup and the grand mean of the population. 

Chart, box and whisker chart

Description automatically generated
Chart, scatter chart

Description automatically generated

For example, if we are studying the height of a population, it is expected that the height of people from different regions (e.g., north, south, east, west of Canada) will be disparate from each other. If we separate the population into groups according to the region, we can calculate heterogeneity by measuring the variation of height between each group. If a population has a high value of heterogeneity, it will cause some problems to model training, causing a low testing accuracy.

Now for the fun part, using heterogeneity in a sentence by the end of the day!

Serious: The between-group heterogeneity in the training dataset made some negative impacts to the model training and therefore resulted in low testing accuracy.

Less serious: Today’s dinner was so wonderful! We had stewing beef, fried chicken, roasted lamb, and salads. There is so much heterogeneity in today’s dinner!

See you in the blogosphere!

Linxi Chen

MiWORD of the day is…logistic regression!

In a neuron, long, tree-like appendages called dendrites receive chemical signals – either excitatory or inhibitory – from many different surrounding neurons. If the net signal received in the neuron’s cell body exceeds a certain threshold, then the neuron fires and the electrochemical signal is transmitted onwards to other neurons. Sure, this process is fascinating, but what does it have to do with statistics and machine learning?

Well, it turns out that the way a neuron functions – taking a whole bunch of weighted inputs, aggregating them, and then outputting a binary response – is a good analogy for a method known as logistic regression. (In fact, Warren McCulloch and Walter Pitts proposed the “threshold logic unit” in 1943, an early computational representation of the neuron that works exactly like this!)

Perhaps you’ve heard of linear regression, which is used to model the relationship between a continuous scalar response variable and at least one explanatory variable. Linear regression works by fitting a linear equation to the data, or, in other words, finding a “line of best fit.” Logistic regression is similar, but it instead “squeezes” the output of a linear equation between 0 and 1 using a special sigmoid function. In other words, linear regression is used when the dependent variable is continuous, and logistic regression is used when the dependent variable is categorical.

Since the output of the sigmoid function is bounded between 0 and 1, it’s treated as a probability. If the sigmoid output for a particular input is greater than the classification threshold (for instance, 0.5), then the observation is classified into one category. If not, it’s classified into the other category. This ability to divide data points into one of two binary categories makes logistic regression very useful for classification problems.

Let’s say we want to predict whether a particular email is spam or not. We might have a dataset with explanatory variables like the number of typos in the email or the name of the sender. Once we fit a logistic regression model to this data, we can calculate “odds ratios” for each of the two explanatory variables. If we got an odds ratio of 2 for the variable representing the number of typos in the email, for example, we know that every additional typo doubles the estimated odds chance of the email being spam. Much like the coefficients in linear regression, odds ratios can give us a sense of a variable’s “importance” to the model.

Now let’s use “logistic regression” in a sentence.

Serious: I want to predict whether this tumour is benign or malignant based on several tissue characteristics. Let’s fit a logistic regression model to the data!

Less serious: 

Person 1: I built a neural network!

Person 2: Hey – that’s cheating! You only used a *single* neuron, so you’re basically just doing logistic regression…

See you in the blogosphere!

Jacqueline Seal

Jacqueline Seal’s Journey in ROP299: Simulating clinical data!

Hi! My name is Jacqueline, and I’m going into my second year at U of T, pursuing a major in Computer Science and a specialist in Bioinformatics. This past summer, I had the opportunity to do a STA299 project with Professor Tyrrell through the Research Opportunity Program, and I’m excited to share my experiences here!

My ROP project for the summer dealt with the simulation of clinical variables relevant to detecting intra-articular hemarthrosis – basically bleeding into the joint – among patients with hemophilia, a disease where patients lack sufficient clotting proteins and are prone to regular, excessive bleeding. Since hemophilia is quite rare, clinical data is often unavailable and so simulation can help us understand what the real data might look like under different sets of plausible assumptions. The ultimate goal was to demonstrate that adding clinical data to Mauro’s existing binary CNN classifier for articular blood detection could boost model performance, as compared to a model trained exclusively on ultrasound images.

Having just completed first year, I went into this ROP with a very limited statistics background and was initially overwhelmed by all the stats jargon being used in lab meetings and in conversations with other lab members. Concepts like “odds ratios,” “ROC,” and “sensitivity analysis” were completely new to me, and I spent many hours just familiarizing myself with these fundamentals. 

After a bit of a slow start, I began my project by identifying physical presentation and clinical history variables to use in my simulation. I was fortunate enough to speak with two distinguished hematologists from Novo Nordisk, Drs. Brand-Staufer and Zak, about the features most relevant to diagnosing a joint bleed. Based on this conversation, I selected two of these variables as a starting point and simulated them according to assumed distributions. Next, I simulated the probability of an articular bleed based on a logistic regression model and used that probability to simulate the “true” presence of a bleed based on a Bernoulli distribution.

Then, I took a bit of a fun detour: figuring out how to best match simulated data to real-world bleed probabilities output by Mauro’s model. With some guidance from Professor Tyrrell, I developed a matching algorithm that allowed us to control the strength of the positive correlation between clinical simulated probabilities and classifier probabilities. Perhaps the most difficult part of my project was ensuring that the simulated dataset captured the desired relationships between my explanatory variables and between each explanatory variable and the response variables. Thanks to the advice of Guan and Sylvia, however, I was able to verify these relationships and report on them in a statistically sound manner.

Despite all the obstacles I encountered along the way, despite changing the details of my methodology several times, despite making slow progress and occasionally feeling like I was going in circles, I’m very grateful to have had this opportunity. Not only did I gain a greater understanding of important statistical concepts and greater familiarity with machine learning techniques, but I also got first-hand experience navigating the research process, from beginning to end. Ultimately, my experience in the MiDATA lab was simultaneously challenging and rewarding, and I would like to thank Dr. Tyrrell for all his guidance this summer – whether it was setting up impromptu meetings to discuss unexpected issues in my data, providing feedback on my results, or simply sharing humorous anecdotes in our weekly lab meetings. Regardless of where this next year takes me, I’m confident that I’ll carry the lessons I learned this summer with me.

Jacqueline Seal

Today’s MiWORD of the day is … YOLO!

YOLO? You Only Live Once! Go and take adventures before we waste life in the common days, as in The Motto by Drake.

Well, maybe we should go back from the lecture hall of PCS100 (Popular Culture Study) to the classroom of computer science and statistics. In the world of algorithms, YOLO refers to You Only Look Once. Its name has indicated that it is very powerful with full confidence on its efficiency. But what is such a powerful algorithm and how does it work?

YOLO is an algorithm of bounding box regression that performs object detection. It can recognize the classes of objects in images and bound those objects with predicted boxes, where the tasks of classification and localization are completed at the same time. Compared with previous region-based algorithms like R-CNN, YOLO is more efficient because it is region-free.

Object detection methods usually use sliding windows to go through the whole image and see whether there is an object in each window. Region-based algorithms like R-CNN apply Region Proposal to reduce the number of windows to check. YOLO is different as it makes predictions on the entire image at the same time. As an analogy for fishing, R-CNN first divides the regions and picks those regions where fish might occur, while YOLO puts a fishing net and catch fishes together. YOLO divides the image into grids where each grid recognizes an object whose center is inside the grid by its bounding boxes. When several grids declare that an object occurs inside, non-maximal suppression is applied to only keep the grid with highest confidence. Thus, the combination of grid confidence and grid predicted bounding boxes could tell the final classification and localization of each object in the image. 

As the development of region-free algorithms, there have been several versions of YOLO. One practical and advanced version is YOLOv3, which is also the version that I put in my project. It is widely applied in many fields, including the popular auto-driving and … also medical imaging analysis! YOLOv3 is popular because of its efficiency and simple usage, which could save much time for any potential user.

Now we can go to the fun part! Using YOLO in a sentence by the end of the day (I put both serious and not together):

Manager: “Where is Kolbe? He was supposed to finish his task of detecting all the tumors in these CT images tonight! Had he already gone through all thousands of images during the past hour?”

Yvonne: “Well, he was pretty stressed about his workload and asked me if there is any quick method that can help. I said YOLO.”

Manager: “That sounds good. The current version has good performance in many fields, and I bet it could help. Wait, but where did he go? He should be training models right now.”

Yvonne: “No idea. He just got excited and shouted YOLO, turned off the computer and left quickly without any message. I guess he was humming like Tik Tok when phoning with his friends.”

Manager: “Okay, I can probably guess what happened. I need a talk with him tomorrow…”

See you in the blogosphere! 

Jihong Huang

Jihong Huang’s ROP399 Journey

Hi, my name is Jihong Huang and I have finished my third year in computer science and statistics at the University of Toronto. During this summer, I had the great chance to work on my ROP399 project under the guide of Dr. Pascal Tyrell. In such a pandemic, everything was a bit different from usual, including this program. Still, I would like to share my experience and lessons from this summer with you!

After three years in the university and so many different courses in statistics and computer science, I thought that I was totally prepared to take a try in some research projects with knowledge learnt in lectures. However, it turned out that my thoughts were completely wrong! Everything was different from the lectures, where professors will teach step by step with detailed notes. I needed to create my own proposal and design the experiments, independently like a scholar instead of a student. Despite Dr. Tyrrell’s help, I struggled to figure out my schedule for the project. Such an experience was quite unique and special to me compared with time in lecture assignments.

After all the setups, I began to handle the coding part of my project. I picked YOLOv3 as my application of bounding box regression. YOLOv3 is one of the most popular bounding box regression algorithms and it already has excellent performances in many fields. At the same time, it has its complex structures and mechanisms that are longer and more complicated than any code that I have ever learnt. It looks like only the combination of classification and localization, where each single algorithm is easy to understand but the combination is much more advanced than my lectures notes! It took me weeks to roughly figure out its mechanism. Then, I devoted myself to debugging the code. That was difficult, as I was not familiar with most of the packages used. Some issues were caused by different versions of packages, while some were made by subtle wrong code. The adjustments of hyperparameters were also annoying as I usually could not find the optimal solutions for them. Thanks to the great help from Mauro, I finally made my code work on the server successfully.

At the end of the whole trip in my project, I gained a lot of advanced knowledge about bounding box regression and many relating packages, which I would probably never touch before my graduation if I did not take this project. However, my most precious lessons are not about any specific coding ability. The most important lesson is what scientific research is and how it should be done. I learnt that it is very important to make a clear and specific proposal as the plan in the beginning as it would provide the guidelines for any further experiments on coding. Otherwise, it would be easy to go off track and lose the initial goal when thousands of lines of code overwhelm. Also, there could always be failures in scientific research. I spent more than half of my time making and fixing mistakes during the project, which frustrated me a lot in the process. My final conclusion was suggesting that the algorithm selected was not performing well. But they were all common in scientific research. As we learn from failures, the failures are meaningful, and we could make further progress based on them. Thanks to the help from Dr. Tyrrell and all other lab members, it was them that helped me out of frustration during the project and offered me valuable advice.

After this project of three months, I learnt a lot from my first try in the world of scientific research, including coding skills and scientific spirits. This experience provided me with important guidance on my future direction of study and I think all the time and efforts are worthwhile.

– Jihong Huang

Rui Zhu’s ROP399 Journey

I am Rui Zhu. I’ve just completed my third year in the computer science program. I’ve been working in Dr. Tyrrell’s lab on my ROP399 project in the past summer, which is a new and wonderful experience for me.

When I am writing down this reflection, and at some other decision-making moment in the future, it reminds me of the interview with Dr. Tyrrell, where he asked me why I chose his lab and why he chose me. I had tons of reasons for choosing his lab. However, honestly, it was hard for me to put up a whole sentence to answer why he would choose me. “I haven’t done research before, and everything needs a start,” I remember I said unconfidently, “so I need this chance to see if I am really interested in it and see how it goes”. Fortunately, I received Dr. Tyrrell’s offer a few days after the interview, and my very first research experience started.

My ROP project is on imperfect gold standard, which is the consensus of the readers. More specifically, the project is about training models on dataset labelled by readers who make mistakes. At first, I started by reading a lot of papers on robust learning. However, when I had my first meeting with Dr. Tyrrell and Atsuhiro, who kindly helped me with my project, I could not answer what is the definition of imperfect gold standard and why we need consensus of the readers. Atsuhiro helped me out. He explained the problem in real-world applications, where multiple readers annotate a huge dataset without looking at each other’s labels, because it is time-consuming and costly. I learnt the lesson that doing research starts by thinking why I am doing this rather than thinking how to do it. I kept getting questions like why my project is meaningful.

After sorting my mind, I began writing my premise, purpose, hypothesis, and objectives. I thought it was difficult to write up a whole page for these things, but after finding out that I should not assume people know why I am doing the project, I explained everything to readers in my introduction. It was easier than I thought to put up a whole page. After finishing my premise, purpose, hypothesis, and objectives, I combined them together to be a full introduction. Everything flowed like water.

When I was writing the actual code for my project, not many difficulties were met, as I was getting help from Atsuhiro and Mauro. I wanted to thank them for their help. Mauro taught me how to use Pytorch Lightning, which structured Pytorch code in a way easy to understand. Atsuhiro helped me confirm my experimental methodology and gave me guidance on what robust learning techniques to use for my project. Moreover, I started very early to familiarize myself with the code.

Overall, the journey on my summer ROP research was wonderful. I learnt how to start research from scratch and some knowledge in robust learning, although I am only scratching the surface of it. It was a pleasure for me to work in Dr. Tyrrell’s lab this summer. I look forward to what I can do in the future in the world of research.

– Rui Zhu

MiWord of the Day Is… Heatmap!

Do you know what this graph stands for? It is a heatmap about the economic impacts of the world’s coronavirus pandemic on March 4th, 2021. 

Cool, right? You must be interested in the heatmap. What is it? And what does it do? 

A heatmap is a two-dimensional visual representation of data using colors, where the colors all represent different values by hue or intensity. Heatmaps are helpful because they can provide an efficient and comprehensive overview of a topic at-a-glance. Unlike charts or tables, which have to be interpreted or studied to be understood, heatmaps are direct data visualization tools that are more self-explanatory and easier to read.

Heatmaps have applications in different fields, from Google maps showing how crowded it is to webpage analysis reflecting the number of hits a website receives. 

You can imagine heatmaps are also applied in medical imaging to comprehend the area of interest that the neural network uses to make the decision. They use gradients from a pre-trained neural network to produce a coarse localization map highlighting the vital regions of the image for predicting the image’s classification. For example, the heatmap is used to detect the blood patterns in the hemophilia knee ultrasound images to help doctors diagnose hemarthrosis.

Now on to the fun part, using Heatmap in a sentence by the end of the day! (See rules here)

Serious: We use heatmaps to check whether the model is detecting the domain of interest. 

Less serious: * On the road“Which way should we go next?” “Right side! There are fewer people than the left side.” “How do you know?” “Heatmap said!”

… I’ll see you in the blogosphere.

Qianyu Fan

Qianyu Fan’s ROP299 Experience

My name is Qianyu Fan, and I finished my first year at the University of Toronto, pursuing a statistics specialist. This summer I was given the incredible opportunity to work in Dr. Tyrrell’s lab for the ROP299 course. These four months, I have gone through pain and suffering, underwent a metamorphosis, and finally reaped the fruits.

I still remembered that I promised Professor Tyrrell during the interview that I would put twice as much effort as others to complete scientific research. Even if I had no experience with machine learning and neural networks, even if I hadn’t heard of them, the professor was welcome to accept me! During the weekly meetings, terminologies were hard for me to understand, though I tried to research them afterward. And so, I began my research in a daze.

Early on, I floundered to find a focus. The topic “Compare Image Similarity” is huge, where I could do the research on many sides. For instance, we could use different distance metrics to explore the similarities between synthetic and real images. Also, whether replacing real with synthetic images will improve the model accuracy in the training process is a meaningful topic. Due to many interesting ideas for the project, I was lost, and the proposal had been constantly revised. As other ROP students were starting to write their projects, I was still stuck in the proposal and was anxious about the progress. The professor understood my situation and helped me redefine my direction, because he cared about what the students learned in the course. So, my theme was: Comparison of Two Augmentation Methods in Improving Detection Accuracy of Hemarthrosis. We used data synthesis and traditional augmentation techniques to explore and compare the recognition accuracy with increasing proportions of augmented data.

As the deadline was approaching, I had the idea of giving up due to no results. Once in the private meeting with the professor, I broke down and cried. What a shame! He gave me much support and understood my frustration. Mauro was very helpful in offering the datasets as well as allowing me to use his codes and solving my questions. Thanks to their help, my thinking became clear, and I was able to complete the project on time.

A tortuous but unforgettable journey is over. I have learned a lot of things in this ROP course, from machine learning to scientific research. This will be an asset in my life. I appreciate that the professor gave me this opportunity and that I was able to complete my project.

Qianyu Fan

Jenny Du’s ROP299 Journey: Telling apart the real and the fake!

My name is Jenny Du, and I have just wrapped up my ROP299 project in the Tyrrell Lab, as well as my second year at the University of Toronto, pursuing a bioinformatics specialist. Looking back, it was a bumpy ride, but in the end, this journey was very rewarding and has taught me a lot of things on both machine learning topics as well as the process of scientific research.

Like most of the other ROP299 students, I had no experience with machine learning and neural networks. Despite doing some research beforehand, I found myself googling what everyone was talking about during the weekly meetings (thankfully, they were online) to make sure I was not completely lost. None of my first-year courses had prepared me for these kinds of things! And so, with some uncertainties in my heart, I started my ROP journey.

I decided on my overall research topic fairly early, but the details were adjusted several times as I progressed through my project. My project is about coming up with a way to quantitatively assess a set of synthetic ultrasound images in terms of how “realistic” they look compared to the real ultrasound images. “Realism” here is defined as whether the synthetic images can be used as training images in replacement of the real images without creating too big of an impact on the machine learning algorithm. At first, I came up with a naïve proposal: I will build an algorithm that differentiates real and synthetic ultrasound images, and if the algorithm can classify the two kinds (with high accuracies), then it means that the synthetic images are not realistic, and vice versa. In the weekly meeting, Dr. Tyrrell immediately pointed out why this wouldn’t work. In my proposal, a low accuracy could mean that the synthetic and the real images are very similar, but it could also mean that the algorithm itself is terrible. For example, if my algorithm has 50% accuracy, then it is basically randomly guessing each image, like a coin toss, so its classification is unreliable, to say the least. He suggested that I look online to see how others have done it. There was very little information that directly relates to what I’m doing, but eventually I was able to come up with a plan to extract features from the images using a pre-trained CNN model and measure the cosine similarity score between two images and graph these values into a histogram to see their distribution. Dr. Tyrrell also suggested that I compare the distributions at different equivalence margins to determine how big a mean difference is acceptable.

Thankfully, I was able to find some code online that I was able to use in my project with minor changes, and I was able to produce some distribution data fairly quickly. Then, I encountered what I considered to be the hardest part of my entire project: to statistically interpret and discuss my data and create a conclusion out of it. Since I am not a statistics student, and so my knowledge of statistics is limited to one stats course I took as a part of my program requirements. It took a while for me to learn all these statistical concepts and understand why each is needed in my project.

This year was especially interesting since everything was online. Despite not being able to see each other face-to-face, I was still able to receive much support from Dr. Tyrrell and other students in the lab. Mauro was very helpful in preparing the datasets for my project as well as answering any problems related to the codes. Guan also helped to check my statistical calculations and clarifying some hard concepts. I have also made great friends with the other ROP students this year, and hopefully we will be able to see each other in person when the school re-opens.

Overall, this journey was a wonderful experience, and I have learned many things from it. Not only did I got some familiarity with machine learning topics and their application in medicine, but I have also gained experience in the general academic research process, from coming up with a topic to the actual implementation to the final reports. There were challenges along the way, but in the end, it was very rewarding. I am extremely thankful to Dr. Tyrrell for the guidance and support and am grateful for this opportunity.

Jenny Du