The Adventures of Alana the Newbie Researcher

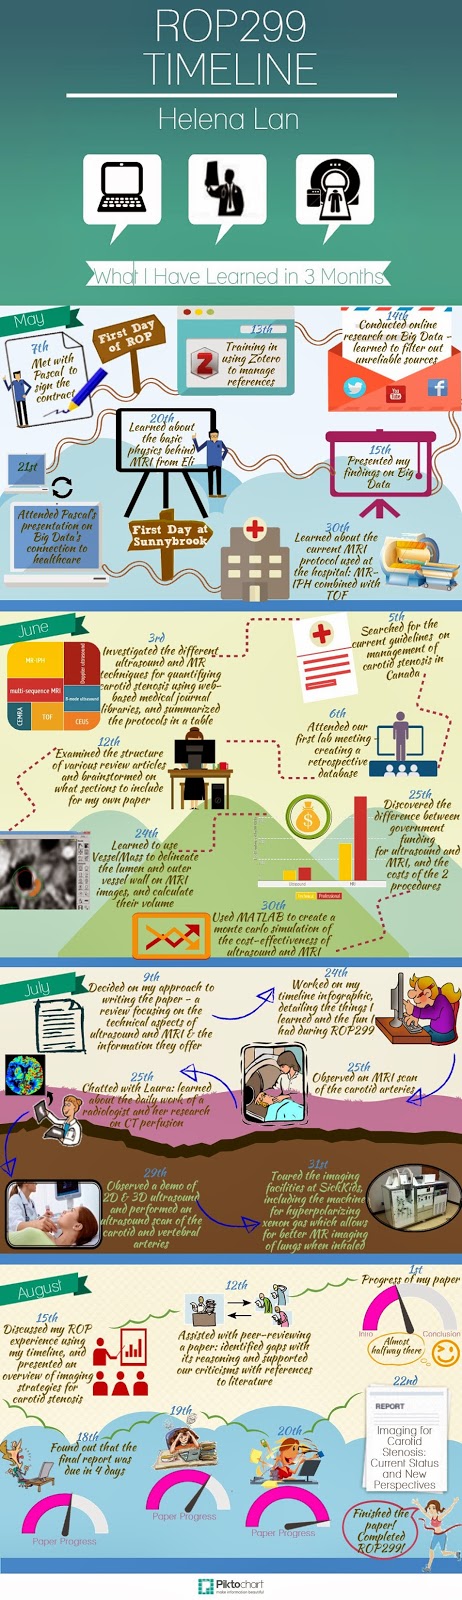
Timeline of my ROP experience

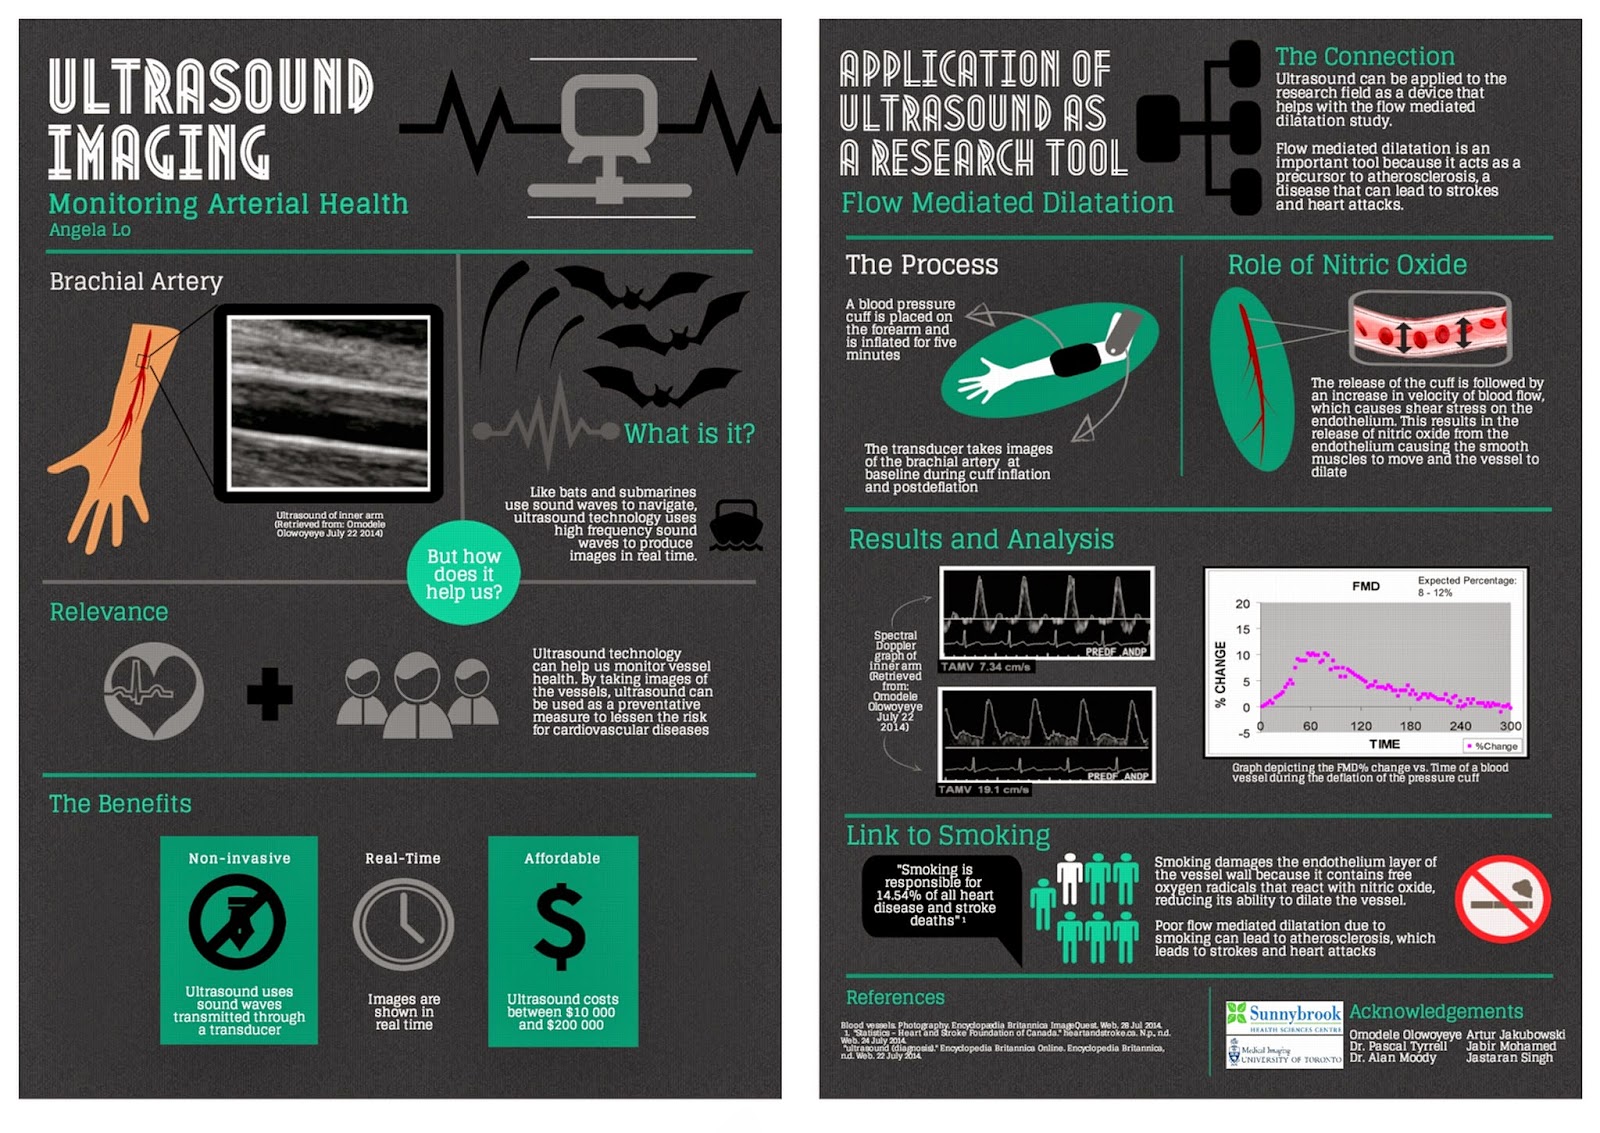
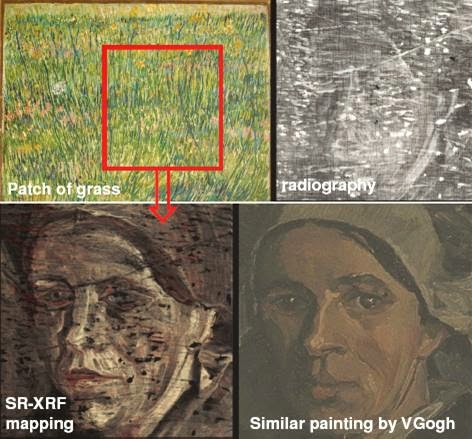
Stroke. Atherosclerosis. Carotid stenosis. MRI. Endarterectomy. To some people, these words are, well, just words. But for others, these few phrases could change the course of their lives. During my time in the Research Opportunity Program at the Department of Medical Imaging, I was able to learn all about carotid disease and the current status of carotid imaging modalities. As an added bonus, I did quite a bit of research on the impact that stenosis has on patient care and how new and exciting advances in medical imaging could affect it.


Over the course of four months, I went from being a huge research newbie to becoming an experienced research … trainee. I was introduced to the world of journal article writing, starting from doing elementary literary research all the way to drafting and writing a review article, which was completed entirely from the comfort of my beloved computer. With the help of Doctor Eli Lechtman and my ROP partner Helena Lan (if you haven’t seen her post on her experience you should check it out), we were able to put together 2 review articles that complement one another and will hopefully pose as a good foundation for future research.


Now, you must be thinking, “wow, this sounds like an extremely exciting summer; how could it possibly be better?” Well, my dear readers, it gets even better. One of the greatest things about being a part of this department is the community. The people here are all friendly, wonderful, and welcoming. From having an outing at Centre Island to letting us operate an uItrasound machine (thanks Modele!), I really felt like I was a part of “the gang.” What’s more, it was nice to have someone remember my name when I arrived in the morning, especially when I’m used to being my nameless self in the vast sea of students of our first year lectures (Convocation Hall, anyone?).


When I first sat down to write this post, I couldn’t decide what would be the best way to describe my time doing my ROP. And that’s when it hit me: it was an adventure! I may not have explored unknown lands or survived any near-death experiences, but there was not one day that went by where I wasn’t learning something new. Each day was a new experience, an opportunity to understand something I probably haven’t even heard of before. It still surprises me right now, as I’m writing this post, how much I have learned throughout this program, and the fact that I was able to experience something like this. I would have never thought I could write a review article and do the things I’ve done in only my first year of university. All in all, this was a great experience, and I encourage everyone to try out something like this!


Thanks for reading this, y’all! And if you just scrolled to the bottom of this post and thought “tl;dr,” you can still check out my infographic timeline (there’s pretty pictures)! Also I’d like to give a shoutout to my awesome Professor, Dr. Pascal Tyrrell (check out his latest post), as well as all the lovely members of the Medical Imaging department at U of T for making my ROP experience the way it turned out to be.


Remember to make every day an adventure,


Alana Man 🙂

Helena Lan: Summer 2014 ROP

Helena Lan Summer 2014 ROP

What is research like? If you had asked me this
question several months ago, I would have answered, “You wear a lab coat and
goggles while mixing chemicals or observing organisms. Hopefully something
interesting will happen, so that you get to publish your findings!” Well, after
participating in the Research Opportunity Program (ROP) at the University of
Toronto, I discovered that medical imaging research is more than just
pipetting, and is all the more exciting!

 
So what kind of research is conducted in the medical imaging world? For my ROP, the objective of my project was to evaluate the roles of the non-invasive imaging modalities for diagnosing carotid stenosis. Hence, I engaged in online literature research of the various imaging techniques for assessing this disease. In this process, I also learned to use Zotero to manage all my references, which provides an easy way to generate a bibliography (when the software doesn’t crash every time you open it). After gathering all the pertinent information, I then put together a review article suggesting how a change in the current imaging approach could potentially improve clinical outcome. Who knew a report could be compiled without doing the lab grunt work?     
 
Wait, so this is all a radiologist does? Sitting in front of a computer and typing all day? Of course not! During our time at Sunnybrook Hospital, we got the chance to chat with a radiologist and discovered that she could decide whether patients should be released after taking a look at their diagnostic images. Pretty powerful, eh? That’s not all. We also found out how radiologists identified any abnormalities in patients, as we had the opportunity to work with the VesselMass software which allowed for the delineation of the lumen and vessel wall of arteries on MRI images. Oh, and did I mention we observed an MRI and an ultrasound examination of the carotid arteries, and even got to perform an ultrasound scan ourselves. Super cool!
 
Still craving for more of my ROP experience? Check out my timeline infographic! You will find all the things I learned and all the fun I had there. Last but not least, I’d like to shout out a big THANK YOU to Prof. Pascal Tyrrell and Dr. Eli Lechtman, who guided us every step of the
way. Also, I’m very grateful to Dr. Alan Moody for including us in his research program at Sunnybrook, as well as other members of the VBIRG group who gave us the chance to
participate in various activities. My summer would not have been this fun and meaningful without all of your help!
 
Have fun researching,


Helena Lan
 

MiWord of the Day is… Supernova!

So, what does medical imaging have to do with a Supernova? Well in the B-movie – Supernova a deep space medical ship responds to a distress signal from a nearby mining planet and gets too close to a Red Supergiant ready to go Supernova. Is your geek alert tingling?


Well, believe it or not Supernovas are explosions of giant stars. Nuclear fusion produces iron in the cores of these stars. Such dense matter at the core creates a tendency for the star to collapse on itself due to gravitational pull. This is kept in check by the massive amounts of energy the star is constantly releasing. But what happens when the star starts to run out of fuel? Yup, you guessed it. It collapses on itself and implodes. As the star rushes inwards, protons and electrons combine to produce neutrons that in turn collide with the core and produce a crazy big explosion. This sudden release of energy is accompanied by the production of x-rays. Yes, I am serious. What is left behind of the exploded star is either a neutron star or a black hole depending on the mass of the remains.


So, a supernova is essentially a giant x-ray machine? Maybe not. However, by studying these cosmic x-rays astronomers are able to help describe the structure of the universe (not Castle Greyskull). Cool. 


Question for you: should we be concerned with being exposed to cosmic x-rays?  No. Cosmic x-rays are pretty much completely filtered out by our atmosphere by the time they get to the surface. So, how do astronomers get readings? Good question. By placing their recording instruments on satellites and spacecraft, of course!


Now on to using supernova in a sentence today:
Serious example – So did you catch the last supernova in our galaxy? Happened about 400 years ago. No? The next one should be soon as it is overdue by about 300 years. 


Less serious – Growing up I always loved the Chevy Nova SS. Especially when it was customized. It surely was a super Nova…


Enjoy Ray LaMontagne – Supernova to recover from today’s post and  I’ll see you in the blogosphere.


Pascal Tyrrell

A YSP Student Perspective: Ultrasound – Not Just for the Unborn Child

Angela Lo, MED YSP 2014 Student
When you think of ultrasound, what’s the first thing you think of? Babies. All that fun stuff. Well, it turns out that ultrasound can be used not only for clinical testing, but also for research purposes. For
example, it can be used as a diagnostic tool to survey images of the body or also used as a device that monitors health conditions in research studies.
During the past three weeks, I (Angela!) have had the opportunity to participate in a research module in the medical imaging department at The University of Toronto. Through this program, I have been exposed to various imaging modalities including both MRI machines and CT scanners, but one of the modalities that interested me most was the ultrasound machine. Why? Because of its noninvasive procedures and its ability to make both 2D and 3D images in real time while still being a fraction of  he cost of an MRI.
Amazing.
During my time in the program, I was also able to observe the various uses of the ultrasound machine and how it can be used as a research tool in the flow mediated dilatation study. Blood vessel health can be studied by having an ultrasound take images of the brachial artery to measure blood velocity and the percent change in FMD. By knowing the percent change, researchers can monitor arterial health and use it as a preventative measure.
Overall I had an amazing experience learning about all he imaging modalities and the great benefits and potential each one holds.
Happy reading,
Angela Lo

MiWord of the Day Is… Pentimenti!

What!!? Do you find it on pizza or in the middle of green olives? Well actually, it is a word of Italian origin and describes minor changes in a painting during its composition. So, similar to erasing some of your hand writing and then writing over it again with the corrected text. I guess for you younger folk it would be like pressing back-space and then re-typing! The difference of course is that there would NOT be any pentimenti as there would no trace of your previous attempt…


So what does this have to do with medical imaging? In our last Mi word of the day we talked about x-rays. Now, today we take x-rays and our ability to peer inside the human body for granted. So what else can we see with x-rays? Believe it or not x-rays can also help to reveal how a painting evolved from first brush strokes to finished product. X-ray analysis can help to describe the paint composition to the different layers that may exist in the painting.


Consider, for example, “Patch of Grass” by Van Gogh seen above. It was discovered by x-ray analysis that this 1887 painting completely concealed a portrait of a woman that Van Gogh had painted over. He often did this to save money on canvases (maybe to buy Absinthe – how naughty!). In this case, in addition to Van Gogh’s pentimenti is his habit of painting over previous works. All of this adds to a type of “fingerprint” that art appraisers use to identify works of art from forgeries… Cool.

Today, we have to use “pentimenti” in a sentence (see rules here). Here are two examples to help you along:

Serious: I wonder how Van Gogh’s pentimenti differs from that of Rembrandt. Maybe I should ask the Musee du Louvre’s curator for some insight.

 
Not so serious: Yes, I would like to order a large pizza with pentimenti, double cheese, and mushrooms. No pentimenti? Alright, pepperoni works just as well…


See you in the blogosphere,


Pascal Tyrrell

Breaking Up Is Hard to Do

Last week I met with Helen, a clinical investigator program radiology resident from our department, about her research (shout out to Dr Laurent Milot’s research group). When discussing predictors and outcomes for her retrospective study it was suggested that some continuous variables be broken up into levels or categories based on given cut-points. This practice is often encountered in the world of medical research. The main reason? People in the medical community find it easier to understand results that are expressed as proportions, odds ratio, or relative risk. When working with continuous variables we end up talking about parameter estimates / beta weights and such – not as “reader friendly”. 


Unfortunately, as Neil Sedaka sang about in his famous song Breaking Up Is Hard to Do, by breaking up continuous variables you pay a stiff penalty when it comes to your ability to describe the relationship that you are interested in and the sample size requirements (see loss of power) of your study.


You are now a newly minted research scientist (need a refresher? See Pocket Protector) and are interested in discovering relationships among variables or between predictors and outcomes. The more accurate your findings the better the description of the relationships and the better the interpretation/ conclusions you can make.The bottom line is that dichotomizing/ categorizing a continuous measure will result in loss of information. Essentially, the “signal” which is the information captured by your measure will be reduced by categorization and, therefore, when you perform a statistical test that compares this signal to the “noise” or error of the model (observed differences between your patients for example) you will find yourself at a disadvantage (loss of power)David Streiner (great author and great guy!) gives a more complete explanation in one of his papers.


Now, as we see in the funny movie with Vince Vaugh and Jennifer Aniston, The Break Up, there are times when categorization may make sense. For example when the variable you are considering is not normally distributed (see Are You My Type?) or when the relationship that you are studying is not linear. We will talk about these situations in a later post.


Don’t forget: you will get further ahead if you keep your variables as continuous data whenever possible.


See you in the blogosphere,


Pascal Tyrrell

MiWord of the Day Is… X-Ray!

Yup! Want some of that. Not only is Superman cool but he has x-ray vision. Unbelievable. Or is it? Radiologists have the same x-ray vision but without the Spandex suit – or at least they don’t wear it to work that I am aware of.


The word of the day is x-ray. You have already successfully used “Roentgen” in casual conversation last week (don’t know what I am talking about? See Mi Word of the Day Is… Roentgen!) and today I will talk a little about what Roentgen was first in measuring and describing – x-rays.


Let’s say you are in your lab and you are working with passing electrical discharges through vacuum tubes – a typical Saturday afternoon activity with friends. As chance would have it your little sister’s barium salts paintings happen to be drying near-by and you notice a faint glow emanating from them every time you run your experiments. No matter how much you try to block any light coming from your vacuum tubes the glow persists. What? That’s odd. How’s that happening? Well my friend, you have just crossed over into the Twilight Zone (awesome old tv series) and discovered a form of electromagnetic radiation.


Visible light is but a very small part of the electromagnetic spectrum. Moving from visible light to longer wavelengths and lower frequencies we find infrared (keeps food warm at restaurants), microwaves (to warm your pizza pop) and radio (not the one streamed through the internet!). 


Now if you move in the opposite direction from visible light you find shorter wavelengths with higher frequencies starting with ultraviolet (what helps you get that summer tan), x-rays (word of the day), and finally gamma rays (topic for another day!). So x-rays are about the size of atoms and radio waves the size of buildings. Crazy. I think what is surprising is that with the naked eye we “see” so little and yet so much (philosophy anyone?).


So, x-rays are short wavelength, high frequency, high energy electromagnetic radiation that is able to penetrate some substances more easily than others. For example, they penetrate flesh more easily than bone, and bone more easily than lead. Thus they make it possible to see bones within flesh and a bullet embedded in bone. The ability of X rays to penetrate depends on their wavelength and on the density and thickness of the substance being scanned.


Now if you remember the rules:


1- I introduce and discuss a word.
2- You have to use the word in a sentence by the end of the day. No need to use it in the correct context – actually out of context is more fun and elicits a more entertaining response!
 
 
Today, we have to use “x-ray” in a sentence. Here are two examples to help you along:

Serious: Hey Frank, did you know the radiation you received during your chest x-ray last week was actually “soft” x-rays? Ones with shorter wavelengths and more penetrating power are used for scanning archaeological artifacts.


Less serious: Frank! Dude, I got them! My x-ray specs just came in the mail. Let’s go the beach…

See you in the blogosphere,


Pascal Tyrrell

MiWord of the Day Is… Roentgen!

Welcome to the first Medical imaging Word of the Day! Here is how it works:


1- I introduce and discuss a word.
2- You have to use the word in a sentence by the end of the day. No need to use it in the correct context – actually out of context is more fun and elicits a more entertaining response!


OK, here we go. The word of the day is Roentgen – typically pronounced “Rent-gun”.

Wilhelm Roentgen was a physicist from northern Germany who in 1895 was the first to detect the now famous x-ray. Interestingly, he was not the first to produce them. The x-ray is part of the electromagnetic spectrum that contains shorter wavelengths (0.01 to 10 nm) than visible light (390-700 nm). We will talk about this in another post as today it is about Roentgen.

 
The interesting discovery was that it was a new kind of light – one that could not be seen but could be detected. Most importantly it gave physicians the ability to peer inside the body of a patient without having to cut it open – a camera that can see inside the body.
 
An interesting and maybe ironic fact is that Roentgen – the discoverer of a new way to “see” – was blind in one eye (from a childhood illness) and color blind
 
Here are some other interesting facts:
 
  • Following his discovery the “Roentgen unit” was described and used to measure x-ray exposure (one R is 2.58×10⁻⁴ C/kg). About 500 R over 5 hours is considered a lethal dose for humans.
  • Roentgen was the first scientist to receive the Nobel prize in physics in 1901. He refused to patent his discovery and gave the entire prize money to his university. Wow, what a guy!
  • He died of colon cancer in 1923.
 
So, now we have to use “Roentgen” in a sentence. Here are two examples:
 
Serious: Hey Frank, I see you just came back from having a chest x-ray. Did you know that you just received about 1/20 of a Roentgen? Oh, and I am glad to hear you don’t have pneumonia…
 
Not so serious: Hello, I will be travelling to Europe this summer and will need to exchange some Canadian dollars for Euros. Could you tell me the exchange rate? And while you’re at it, what is today’s rate on the Roentgen? Never heard of that currency? Really? It’s German I think…
 
 
OK, unbelievably I found a music link to Roentgen! Hyde produced an album named “Roentgen” and one of the main tracks is aptly called “Unexpected“. Yup, I’m serious…
 
 
See you in the blogosphere,
 
 
Pascal Tyrrell