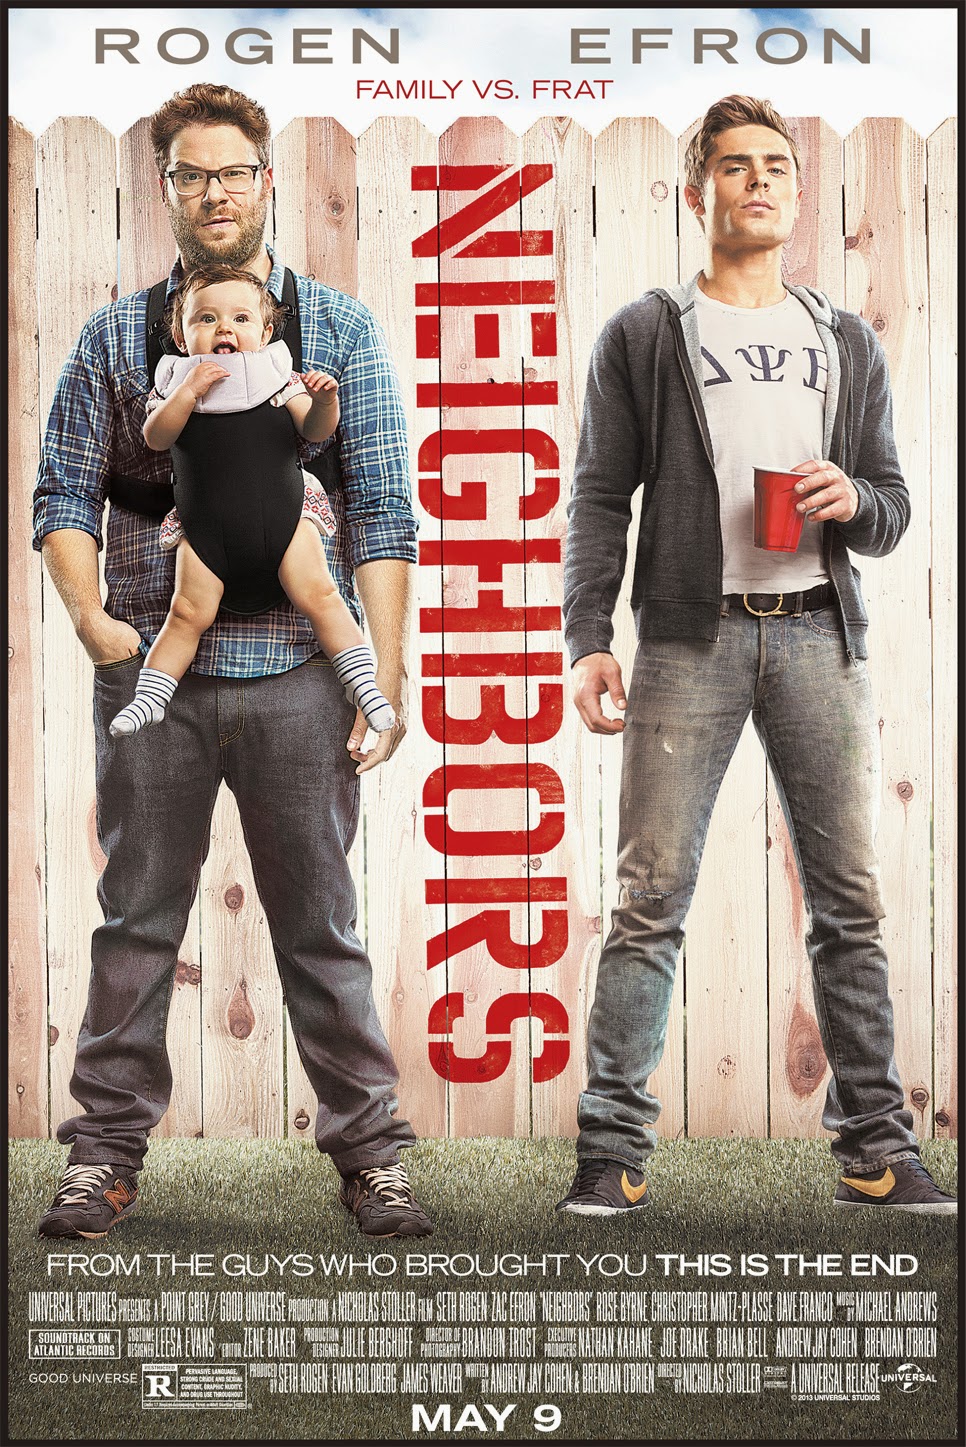
Classic Seth Rogan movie. Today we will be talking about good neighbors as a followup to my first post “What cluster Are You From?“. If you want to learn a little about bad neighbors watch the trailer to the movie Neighbors.
So let’s say you are working with a large amount of data that contains many, many variables of interest. In this situation you are most likely working with a multidimensional model. Multivariate analysis will help you make sense of multidimensional space and is simply defined as a situation when your analysis incorporates more than 1 dependent variable (AKA response or outcome variable).
*** Stats jargon warning***
Mulitvariate analysis can include analysis of data covariance structures to better understand or reduce data dimensions (PCA, Factor Analysis, Correspondence Analysis) or the assignment of observations to groups using a unsupervised methodology (Cluster Analysis) or a supervised methodology (K Nearest Neighbor or K-NN). We will be talking about the later today.
*** Stats-reduced safe return here***
Classification is simply the assignment of previously unseen entities (objects such as records) to a class (or category) as accurately as possible. In our case, you are fortunate to have a training set of entities or objects that have already been labelled or classified and so this methodology is termed “supervised”. Cluster analysis is unsupervised learning and we will talk more about this in a later post.
Let’s say for example you have made a list of all of your friends and labeled each one as “Super Cool”, “Cool”, or “Not cool”. How did you decide? You probably have a bunch of attributes or factors that you considered. If you have many, many attributes this process could be daunting. This is where k nearest neighbor or K-NN comes in. It considers the most similar other items in terms of their attributes, looks at their labels, and gives the unassigned object the majority vote!
This is how it basically works:
1- Defines similarity (or closeness) and then, for a given object, measures how similar are all the labelled objects from your training set. These become the neighbors who each get a vote.
2- Decides on how many neighbors get a vote. This is the k in k-NN.
3- Tallies the votes and voila – a new label!
All of this is fun but will be made much easier using the k-NN algorithm and your trusty computer!
So, now you have an idea about supervised learning technique that will allow you to work with a multidimensional data set. Cool.
Listen to Frank Sinatra‘s The Girl Next Door to decompress and I’ll see you in the blogosphere…
Pascal Tyrrell
What Cluster Are You From?
This week and I had the pleasure of presenting to the Division of Rheumatology Research Rounds – University of Toronto. They were a fantastic audience who asked questions and appeared to be very engaged. Shout out to the Rheumatology gang!
So, I was asked to talk about a statistical methodology called Cluster Analysis. I thought I would start a short series on the topic for you guys. Don’t worry I will keep the stats to a minimum as I always do!
Complex information can always be best recognized as patterns. The first picture below on the left certainly helps you realize that it is not a simple task to know someone at a glance.
Now, I guess it doesn’t help that many of you have never met me either! However, you can appreciate that things get a little easier when the same portrait is presented in the usual manner – upright!

This is an interesting example where the information is identical, however, our ability to intuitively recognize a pattern (me!) appears to be restricted to situations that we are familiar with.

This intuition often fails miserably when abstract magnitudes (numbers!) are involved. I am certain most of us can relate to that.
The good news is that with the advent of crazy powerful personal computers we can benefit from complex and resource intensive mathematical procedures to help us make sense of large scary looking data sets.
So, when would you use this kind of methodology you ask? I’ll tell you…
1 – Detection of subgroups/ clusters of entities (ie: items, subjects, users…) within your data set.
2 – Discovery of useful, possibly unexpected, patterns in data.
OK, time for some homework. Try to think of times when you could apply this kind of analysis.
I’ll start you off with an example that you can relate to. Every time you go to YouTube and search for your favorite movie trailer you get a long list of other items on the right that YouTube thinks may be of interest to you. How do you think they do that? By taking into account things like keywords, popularity, and user browser history (and many, many more variables) and using cluster analysis of course! You and your interests belong to a cluster. Cool!
In this series, we will delve into this fun world of working with patterns in data.
Now that you have peace of mind, listen to The Grapes of Wrath…
See you in the blogosphere,
Pascal Tyrrell


